> For the complete documentation index, see [llms.txt](https://docs.heeler.com/mrecEO40m5D6bt7Pq5pE/llms.txt). Markdown versions of documentation pages are available by appending `.md` to page URLs; this page is available as [Markdown](https://docs.heeler.com/mrecEO40m5D6bt7Pq5pE/administer-and-monitor/operational-health.md).

# Operational Health

Confirm Heeler is analyzing your estate cleanly — scan success rates, what's erroring, guardrail timing, and internal registries it can't yet reach.

[Connection health](/mrecEO40m5D6bt7Pq5pE/administer-and-monitor/connections-and-integrations.md#reading-the-health-column) tells you a source is *authenticated*. **Operational Health** tells you whether Heeler is successfully *processing* it — how much of your estate scanned cleanly, what's failing, how your guardrails are performing, and which internal registries Heeler can see but can't yet read. It's the page to check when coverage feels off or a repository's findings look stale.

{% hint style="info" %}
Administration is admin-only — you need an **Administrator (read-only)** or **Administrator** role to view this page.
{% endhint %}

Open **Administration → Operational Health**. The overview at the top can be collapsed once you know your numbers.

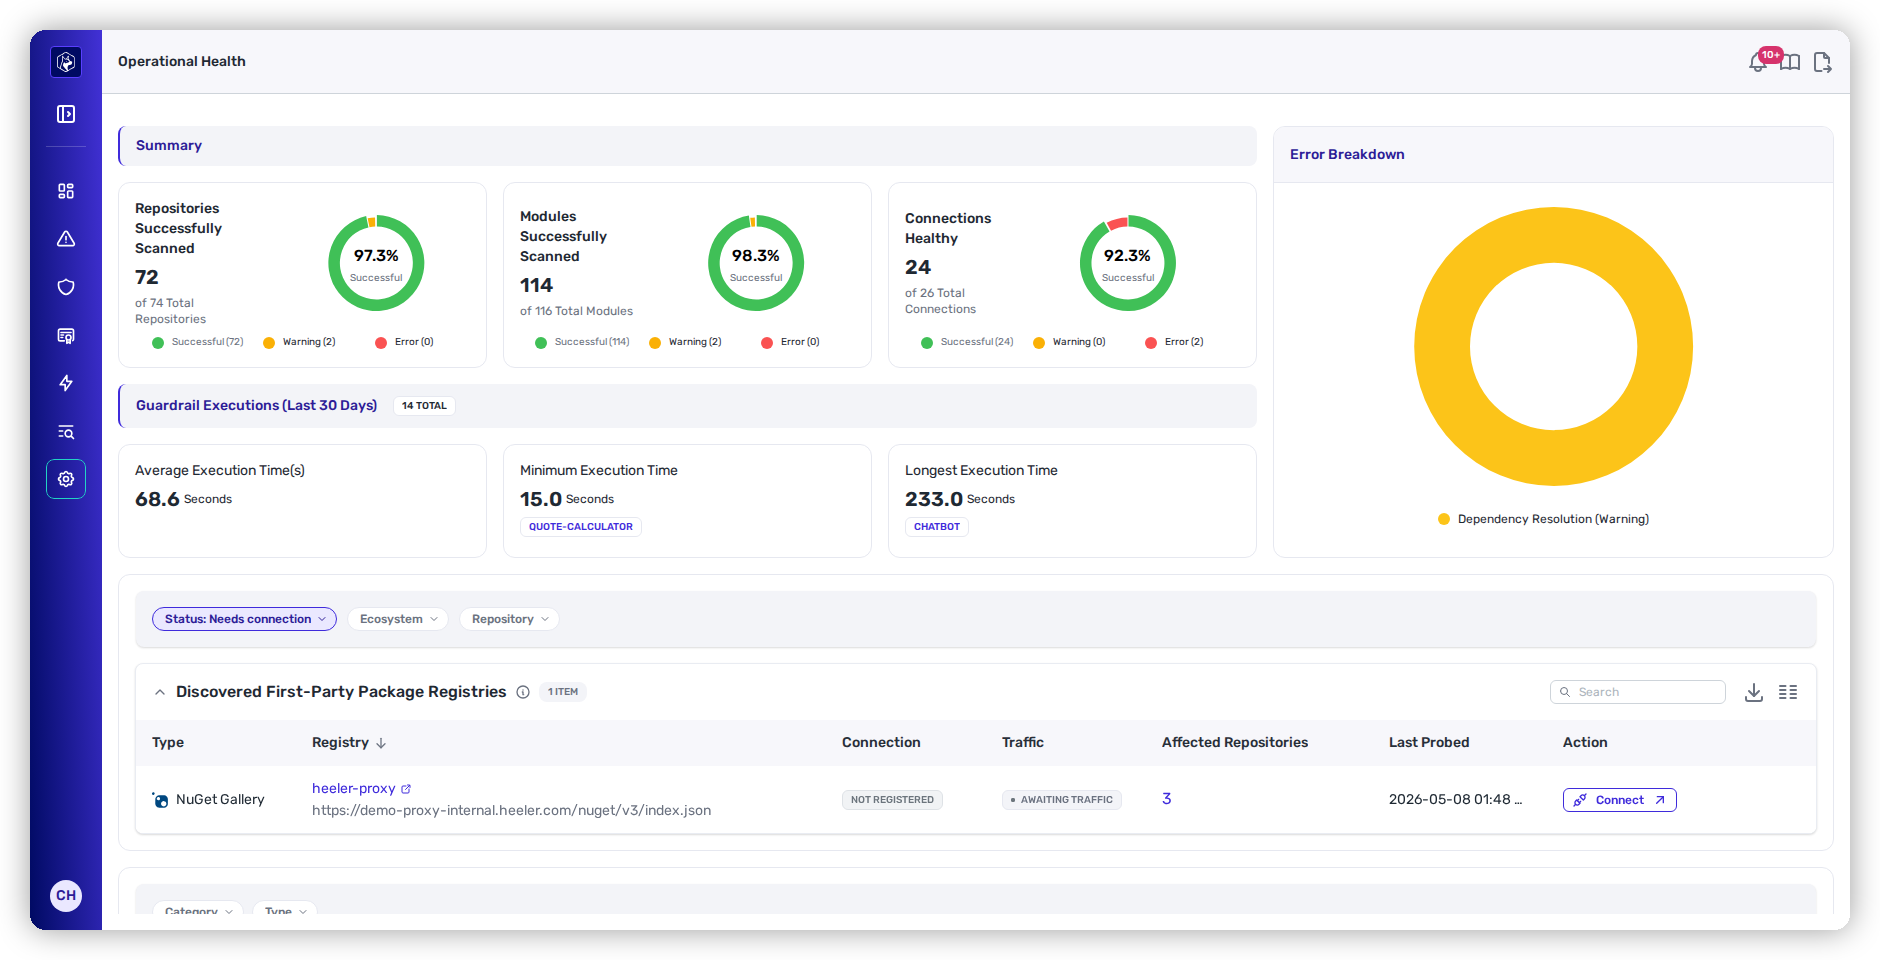
<figure><img src="https://414480750-files.gitbook.io/~/files/v0/b/gitbook-x-prod.appspot.com/o/spaces%2FXP3dp2kecwKA2KvYkntz%2Fuploads%2Fgit-blob-8518f743b6b489fb5a5067ccb58849325f77bb6a%2Fam-op-health.png?alt=media" alt="The Operational Health page: a Summary with repository, module, and connection-health donuts, an Error Breakdown, Guardrail Executions timing, and a Discovered First-Party Package Registries table."><figcaption><p>Operational Health — scan success, error breakdown, guardrail timing, and registry probe health.</p></figcaption></figure>

## Summary panel

Three donuts show how much of your estate Heeler covered successfully:

* **Repositories Successfully Scanned** — e.g. "72 of 74," with the remainder split into **Successful / Warning / Error**.
* **Modules Successfully Scanned** — the same, one level down, since a repository can contain several modules.
* **Connections Healthy** — how many of your configured connections are reporting healthy, split the same way. Unlike the other two, this is about the integrations feeding Heeler rather than what it scanned.

The **Warning** and **Error** chips are clickable — they filter the table at the bottom of the page to the repositories or modules in that state.

## What counts as a Warning vs. an Error

The distinction is about whether Heeler could still produce a result:

<table><thead><tr><th width="150">State</th><th>What it means</th></tr></thead><tbody><tr><td>✅ <strong>Successful</strong></td><td>Scanned cleanly.</td></tr><tr><td>⚠️ <strong>Warning</strong></td><td>Heeler worked around a degradation and still produced results — a partial SCA, SAST, or secrets pass, service-fingerprinting gaps, or a degraded dependency resolution. Worth improving, but you still have findings.</td></tr><tr><td>❌ <strong>Error</strong></td><td>Processing was blocked, so there's no complete result — a failed dependency resolution (no bill of materials could be built) or an access failure cloning the repository.</td></tr></tbody></table>

## Error Breakdown

A donut groups the issues by category — **SCA, SAST, Secrets, Dependency Resolution, Service Fingerprinting, Access,** and others — each tagged **(Error)** or **(Warning)**. It tells you where problems concentrate, so you fix the common cause rather than chasing repositories one by one. A cluster of **Dependency Resolution** errors, for instance, usually points back to a missing [registry connection](/mrecEO40m5D6bt7Pq5pE/administer-and-monitor/connections-and-integrations/registries.md).

The table beneath it lists the individual issues, with **Repository**, **Module**, **Category**, **Description** and **Detected** — the time Heeler first recorded that issue. Clicking a **Warning** or **Error** chip at the top of the page filters this table to just that state.

## Guardrail Executions (last 30 days)

How your PR guardrails are performing, so you catch a guardrail that's slowing developers down:

<table><thead><tr><th width="240">Metric</th><th>What it tells you</th></tr></thead><tbody><tr><td><strong>Total</strong></td><td>How many guardrail checks ran in the window.</td></tr><tr><td><strong>Average Execution Time</strong></td><td>Typical time to complete a check.</td></tr><tr><td><strong>Minimum Execution Time</strong></td><td>The fastest run, with the repository named.</td></tr><tr><td><strong>Longest Execution Time</strong></td><td>The slowest run, with the repository named — your first place to look if developers report slow checks.</td></tr></tbody></table>

## Discovered First-Party Package Registries

This panel surfaces internal registries Heeler has **discovered in your dependency traffic** but may not be reading from yet — the missing link behind unresolved internal packages.

<table><thead><tr><th width="200">Column</th><th>What it means</th></tr></thead><tbody><tr><td><strong>Type</strong> / <strong>Registry</strong></td><td>The ecosystem and the feed's host or URL.</td></tr><tr><td><strong>Connection</strong></td><td>Whether Heeler is registered to read it (see states below).</td></tr><tr><td><strong>Traffic</strong></td><td>Whether Heeler is actually receiving data from it.</td></tr><tr><td><strong>Affected Repositories</strong></td><td>How many of your repositories depend on it — click to see them.</td></tr><tr><td><strong>Last Probed</strong></td><td>When Heeler last checked it.</td></tr><tr><td><strong>Action</strong></td><td><strong>Connect</strong> if it isn't wired up, or <strong>Manage</strong> if it is.</td></tr></tbody></table>

**Connection** states: **Not Registered** (discovered but not connected — use **Connect**), **Unverified · Review**, **Registered** (connected), and **Public · No Action Needed** (a public feed, nothing to do).

**Traffic** states: **Awaiting Traffic** (connected, nothing received yet), **Reachable** (receiving data), and the failure states **Auth Failed**, **Forbidden**, **Network Error**, and **Not Found** — each pointing at a specific thing to fix (credentials, permissions, connectivity, or a wrong URL).

## Using it day to day

Treat any **Error** count above zero as a to-do: click the chip, see the affected repositories, and fix the common cause. A registry showing **Not Registered** with a high **Affected Repositories** count is high-leverage — one **Connect** can resolve dependencies across many repositories at once.

For step-by-step help resolving what you find here — a repository that won't clone, dependency resolution that keeps failing, or a registry stuck on **Awaiting Traffic** — see [Setup and Connection Issues](/mrecEO40m5D6bt7Pq5pE/troubleshooting-and-faq/setup-and-connection-issues.md).

## Related

* [Connections & Integrations](/mrecEO40m5D6bt7Pq5pE/administer-and-monitor/connections-and-integrations.md) — whether each source is authenticated in the first place.
* [Registries](/mrecEO40m5D6bt7Pq5pE/administer-and-monitor/connections-and-integrations/registries.md) — connect the registries this page discovers.
* [Setup and Connection Issues](/mrecEO40m5D6bt7Pq5pE/troubleshooting-and-faq/setup-and-connection-issues.md) — how to resolve scan and connection errors.
* [Agent Executions](/mrecEO40m5D6bt7Pq5pE/fix/agent-executions.md) — the health of Heeler's remediation agent runs.


---

# Agent Instructions
This documentation is published with GitBook. GitBook is the documentation platform designed so that both humans and AI agents can read, navigate, and reason over technical content effectively. Learn more at gitbook.com.

## Querying This Documentation
If you need additional information that is not directly available in this page, you can query the documentation dynamically by asking a question.

Perform an HTTP GET request on the current page URL with the `ask` query parameter, and the optional `goal` query parameter:

```
GET https://docs.heeler.com/mrecEO40m5D6bt7Pq5pE/administer-and-monitor/operational-health.md?ask=<question>&goal=<endgoal>
```

`ask` is the immediate question: it should be specific, self-contained, and written in natural language.
`goal` is optional and describes the broader end goal you are ultimately trying to accomplish on behalf of the user. GitBook uses it to tailor the answer towards what is most useful for that goal.

The response will contain a direct answer to the question and relevant excerpts and sources from the documentation.

Use this mechanism when the answer is not explicitly present in the current page, you need clarification or additional context, or you want to retrieve related documentation sections.
