> For the complete documentation index, see [llms.txt](https://docs.heeler.com/mrecEO40m5D6bt7Pq5pE/llms.txt). Markdown versions of documentation pages are available by appending `.md` to page URLs; this page is available as [Markdown](https://docs.heeler.com/mrecEO40m5D6bt7Pq5pE/findings/open-source-sca/findings.md).

# SCA Findings

The SCA findings inventory — the Active/Fixed/Deployed lifecycle, every way to search, filter, sort, save, and export the list, how to read a finding, and how to record an exception.

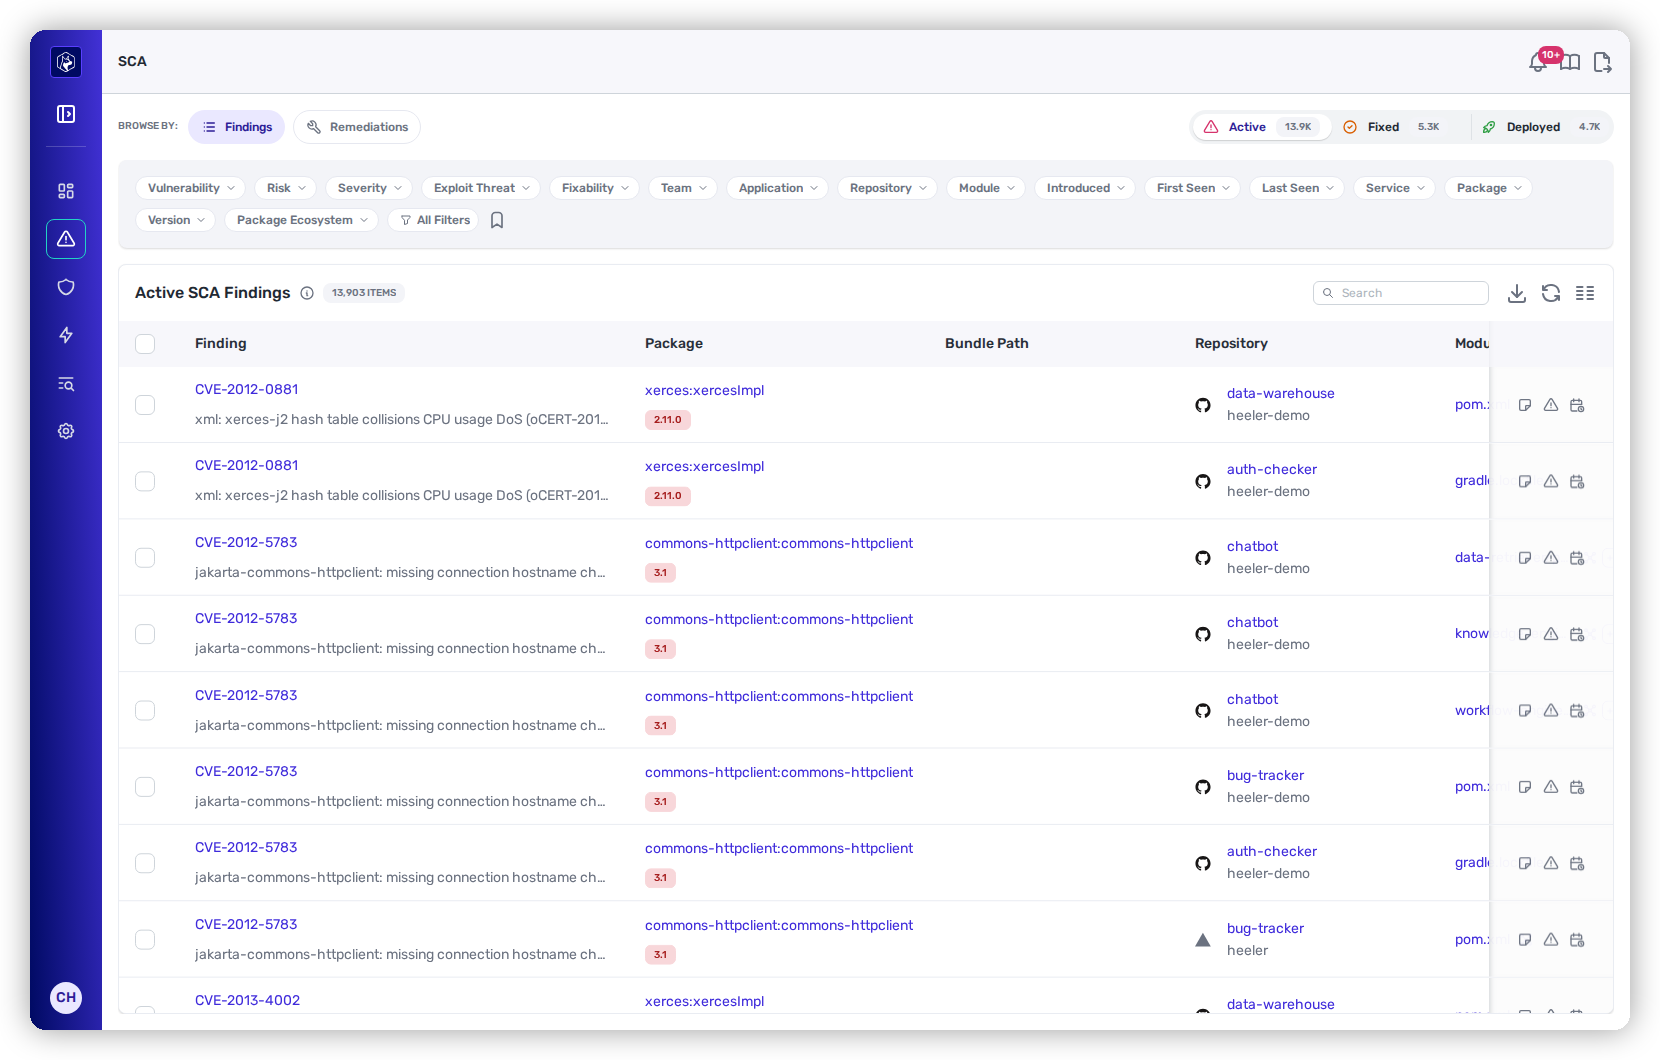
The **Findings** view (**Security → SCA →** *Findings*) is your working inventory of dependency vulnerabilities — **one row per vulnerability, package, and manifest**, so the same CVE appears once for each place it actually lands in your code. This is where you triage what to fix and trace a single CVE across your repositories and running services.

<figure><img src="https://414480750-files.gitbook.io/~/files/v0/b/gitbook-x-prod.appspot.com/o/spaces%2FXP3dp2kecwKA2KvYkntz%2Fuploads%2Fgit-blob-270a015d14f434ed3358ee424088105fadd6067b%2Fcc-sca-findings.png?alt=media" alt="The SCA Findings view: lifecycle tabs, toolbar, filter chips, and the findings table."><figcaption><p>The Findings view — lifecycle tabs up top, the toolbar and filter chips, then one row per finding.</p></figcaption></figure>

## Active, Fixed, and Deployed

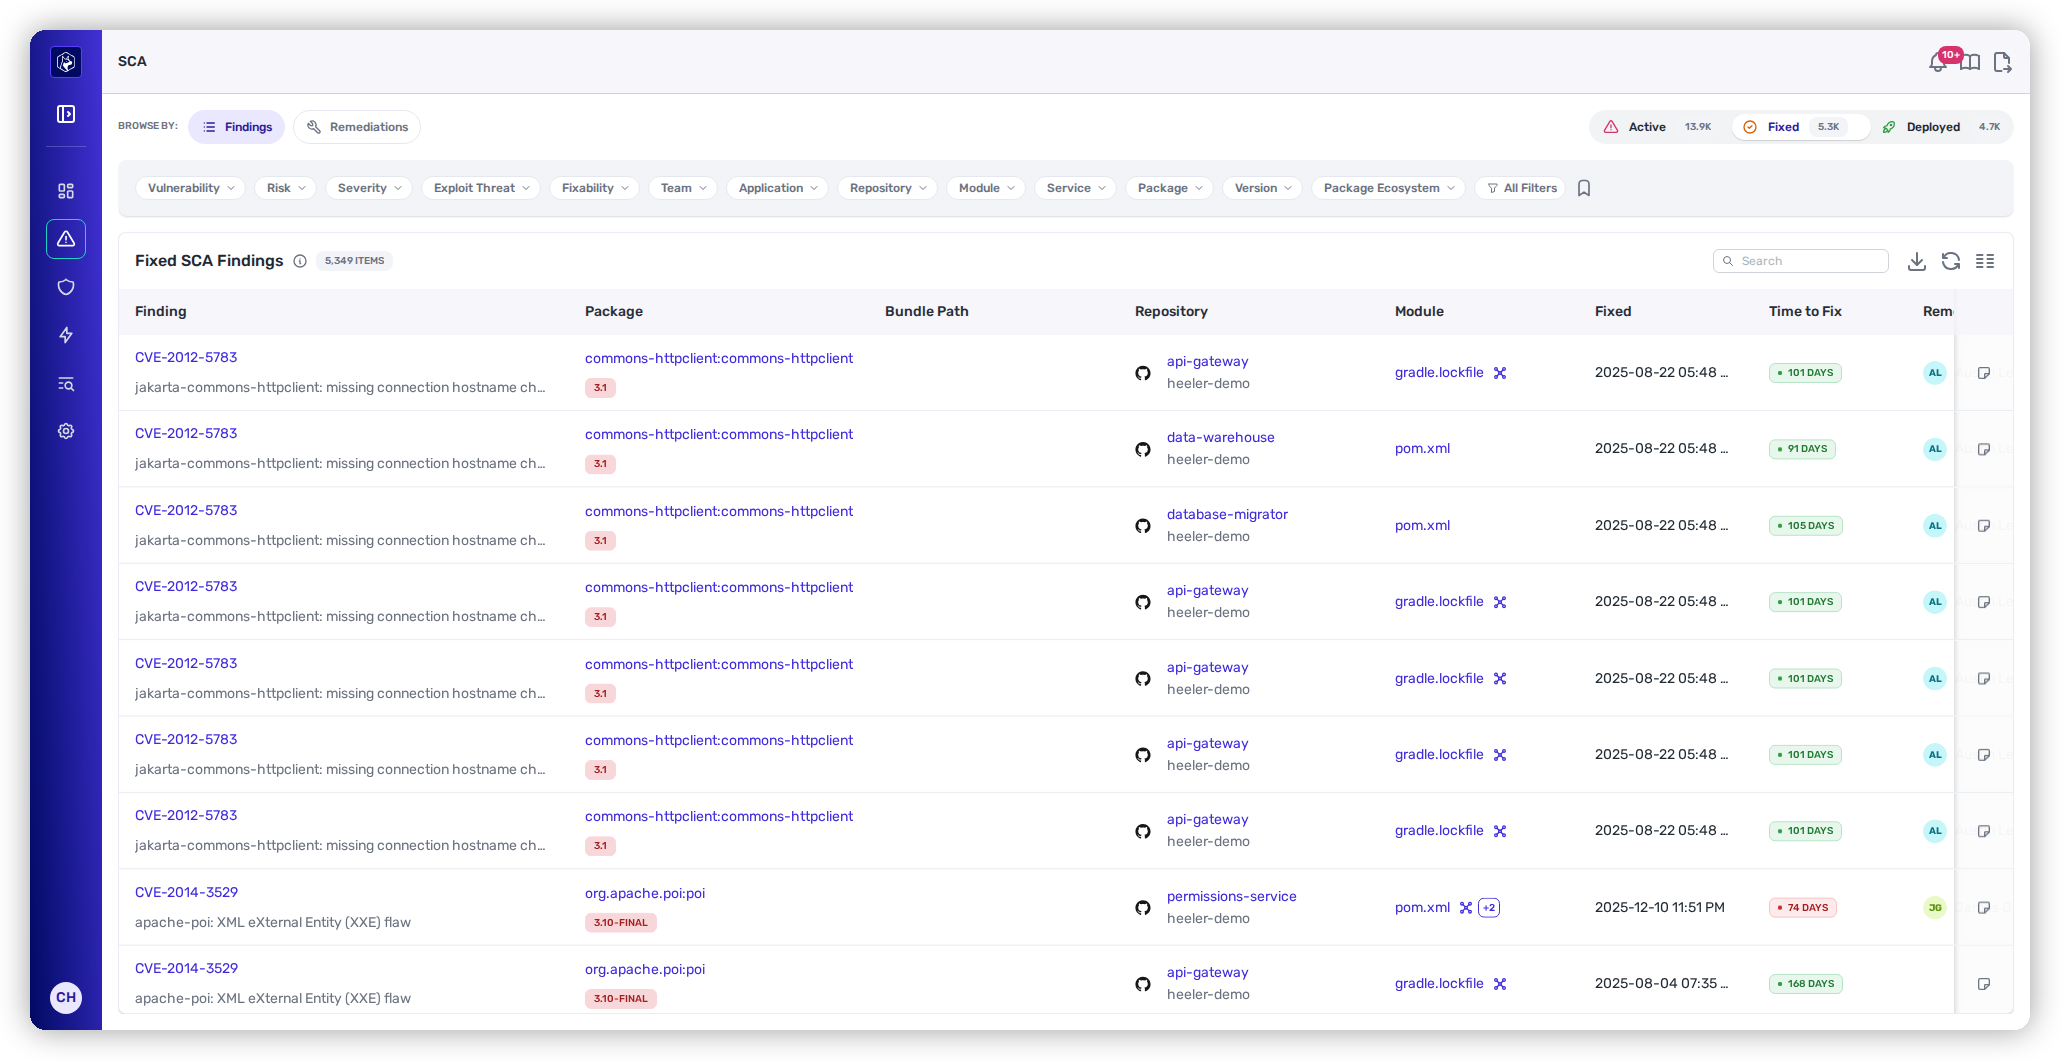
The three tabs above the table are the finding **lifecycle** (see [the findings lifecycle](/mrecEO40m5D6bt7Pq5pE/findings.md#the-findings-lifecycle) for what each state means), and switching between them does more than filter — each tab shows a different population *and* a different set of columns, because the questions you ask about open work, committed fixes, and shipped fixes aren't the same.

{% tabs %}
{% tab title="Active" %}
**The open backlog** — vulnerabilities present in your code and not yet fixed. This is the default view and where day-to-day triage happens.

The table leads with the columns you need to prioritize and act: **Risk**, **Severity**, **Fixability**, **SLO**, **Recommended Version**, **Assignee**, and **Ticket**.
{% endtab %}

{% tab title="Fixed" %}
**Fixed in code** — a fix has been committed, but hasn't necessarily reached your running environments yet.

The columns shift to tell the *fix* story: **Fixed** (when), **Time to Fix**, and **Remediator** (who) replace the prioritization columns. Use this tab to measure remediation velocity and confirm work has landed in the codebase.
{% endtab %}

{% tab title="Deployed" %}
**Rolled out to production** — the fix has been deployed to your running environments, confirmed by correlating deployments back to source. This is the tab that tells you a vulnerability is *actually gone*, not just merged.

It adds a **Rollout Complete** column, and the Package column drops away.
{% endtab %}
{% endtabs %}

<figure><img src="https://414480750-files.gitbook.io/~/files/v0/b/gitbook-x-prod.appspot.com/o/spaces%2FXP3dp2kecwKA2KvYkntz%2Fuploads%2Fgit-blob-37d11b3a6ab9fdf44a3b9338447bebcaf382e8ce%2Fcc-sca-tab-fixed.png?alt=media" alt="The Fixed tab, showing Fixed, Time to Fix, and Remediator columns."><figcaption><p>Switching tabs swaps the columns too — the Fixed tab trades the prioritization columns for <strong>Fixed</strong>, <strong>Time to Fix</strong>, and <strong>Remediator</strong>.</p></figcaption></figure>

{% hint style="info" %}
Each tab carries a live count of the findings in that state.
{% endhint %}

### What the columns mean

The default Active columns, left to right:

| Column                         | What it shows                                                                                                                             |
| ------------------------------ | ----------------------------------------------------------------------------------------------------------------------------------------- |
| **Finding**                    | The CVE and its title — links to the finding detail.                                                                                      |
| **Package**                    | The affected package and its installed version.                                                                                           |
| **Bundle Path**                | Where the dependency is bundled, when the same package lands in more than one artifact.                                                   |
| **Repository** / **Module**    | The repo, and the manifest the dependency resolves from.                                                                                  |
| **Recommended Version**        | The version to upgrade to (`UNKNOWN` when no fix exists yet).                                                                             |
| **Risk**                       | The Heeler Risk band — **Urgent / Plan / Defer**. See [Prioritization](/mrecEO40m5D6bt7Pq5pE/findings/open-source-sca/prioritization.md). |
| **Severity**                   | CVSS tier — Critical / High / Medium / Low.                                                                                               |
| **Fixability**                 | How involved the fix is — or **Auto-Fixable**, meaning Heeler can generate a validated fix.                                               |
| **SLO**                        | Days left to remediate; turns red when overdue.                                                                                           |
| **Assignee** / **Ticket**      | Who owns it, and the linked Jira / Linear / GitHub ticket.                                                                                |
| **Vulnerable Version**         | The affected version range.                                                                                                               |
| **Introduced** / **Published** | When the vulnerability entered your code, and when the advisory was published.                                                            |

Three more columns — **Exploit Threat**, **Last Seen**, and **Last Modified** — are available but hidden by default; turn them on from [Manage Columns](#column-layout).

## Finding dates

**Introduced**, **First seen**, and **Last seen** mean the same thing for every finding type in Heeler, and the date filters built on them behave the same way — so a date range you reason about while triaging dependencies carries the same meaning when you switch to code findings or secrets.

| Term           | What it means                                                                                             |
| -------------- | --------------------------------------------------------------------------------------------------------- |
| **Introduced** | When the finding entered your code — the change that brought it in, not when Heeler noticed.              |
| **First seen** | When Heeler first detected it. Later than **Introduced** for anything that predates onboarding or a scan. |
| **Last seen**  | The most recent analysis that still found it. A finding that stops appearing stops advancing.             |

The distinction that matters in practice: **Introduced** is a fact about your code, while **First seen** is a fact about Heeler's visibility of it. Age and SLO are measured from **Introduced**, which is why a repository onboarded today can immediately show findings that are already overdue.

***

## Working the list

Everything you need to shape the list lives in the toolbar above the table and the filter-chip row beneath it.

### Search

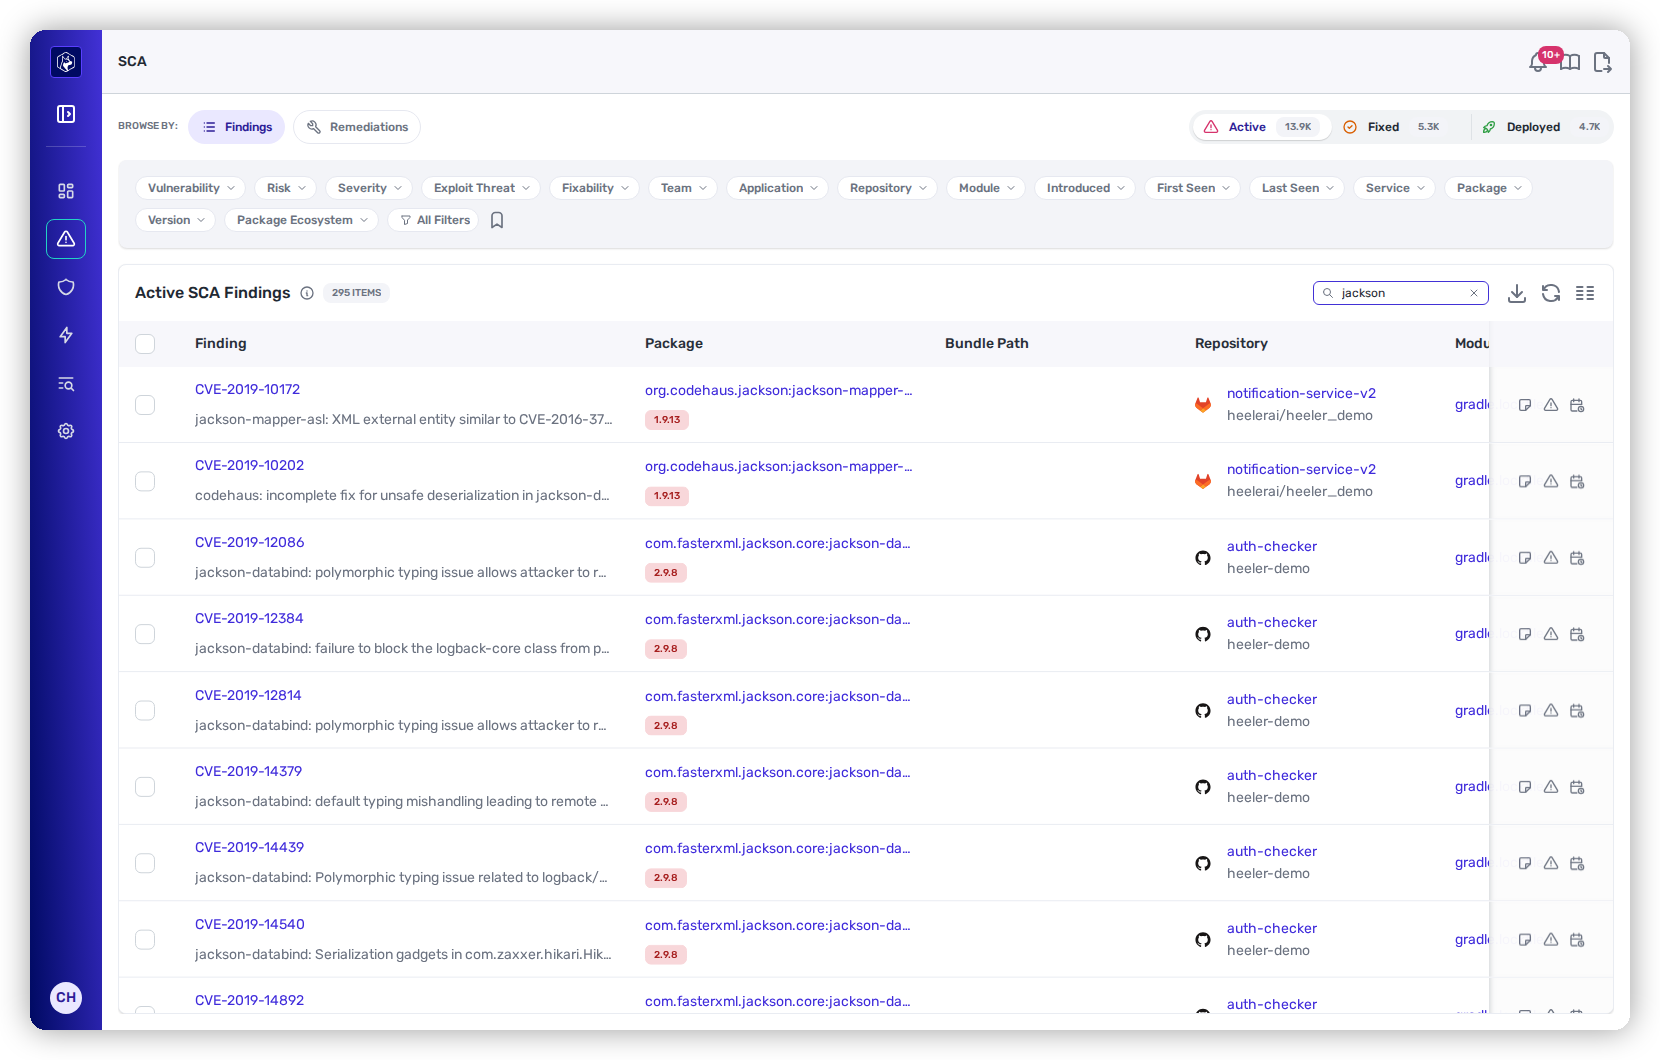
The **Search** box does a full-text match across the **CVE ID**, **package name**, and the **vulnerability title and description** — so `CVE-2018-1000632`, `jackson`, and `deserialization` all work, each narrowing the count as you type. It filters the current tab as you type; clear it with the inline ✕.

<figure><img src="https://414480750-files.gitbook.io/~/files/v0/b/gitbook-x-prod.appspot.com/o/spaces%2FXP3dp2kecwKA2KvYkntz%2Fuploads%2Fgit-blob-1ffc825e46f96bd70173c94ade3f59ceebc85612%2Fcc-sca-search.png?alt=media" alt="Searching the findings list for &#x27;jackson&#x27;."><figcaption><p>Search matches CVE IDs, package names, and description text — here <code>jackson</code> narrows the list to the findings that mention it.</p></figcaption></figure>

### Filtering

Each chip in the filter row is a searchable filter; stacking them narrows the list (values are OR *within* a filter, AND *across* filters). **All Filters** opens the full drawer — star any filter to pin it to the toolbar, or *Restore default layout* to reset.

| Filter                                                 | Options                                                                              |
| ------------------------------------------------------ | ------------------------------------------------------------------------------------ |
| **Vulnerability**                                      | Search for a specific CVE.                                                           |
| **Risk**                                               | Urgent · Plan · Defer                                                                |
| **Severity**                                           | Critical · High · Medium · Low · None                                                |
| **Exploit Threat**                                     | Confirmed · Probable · Unlikely                                                      |
| **Fixability**                                         | Easy · Medium · Hard · Unknown · **Auto-Fixable**                                    |
| **Classification**                                     | Direct vs. transitive, plus reachability — Code Reachable, Runtime Reachable.        |
| **Repository / Module / Service / Application / Team** | Scope to part of your estate.                                                        |
| **Package / Version / Package Ecosystem**              | Scope to a package, version, or ecosystem (npm, Maven, PyPI, Go, GitHub Actions, …). |
| **Introduced**                                         | Last 24 hours · 3 days · 7 days · 30 days · 90 days · Over 90 days                   |

The drawer adds **Finding Status**, **Reachable**, **SLO Status**, **Organization**, **Package Manager** (distinct from Package Ecosystem), **Subgroup**, and **Risk / SLO Override** filters.

<figure><img src="https://414480750-files.gitbook.io/~/files/v0/b/gitbook-x-prod.appspot.com/o/spaces%2FXP3dp2kecwKA2KvYkntz%2Fuploads%2Fgit-blob-8ae432ffa30fda68239f16d0680f0d7005dad780%2Fcc-sca-allfilters.png?alt=media" alt="The All Filters drawer."><figcaption><p>All Filters — the full set; pin any filter to the toolbar.</p></figcaption></figure>

When filters are active, an **All Filters** badge shows how many, and a **✕** appears beside it to **clear them all at once**.

### Saved views

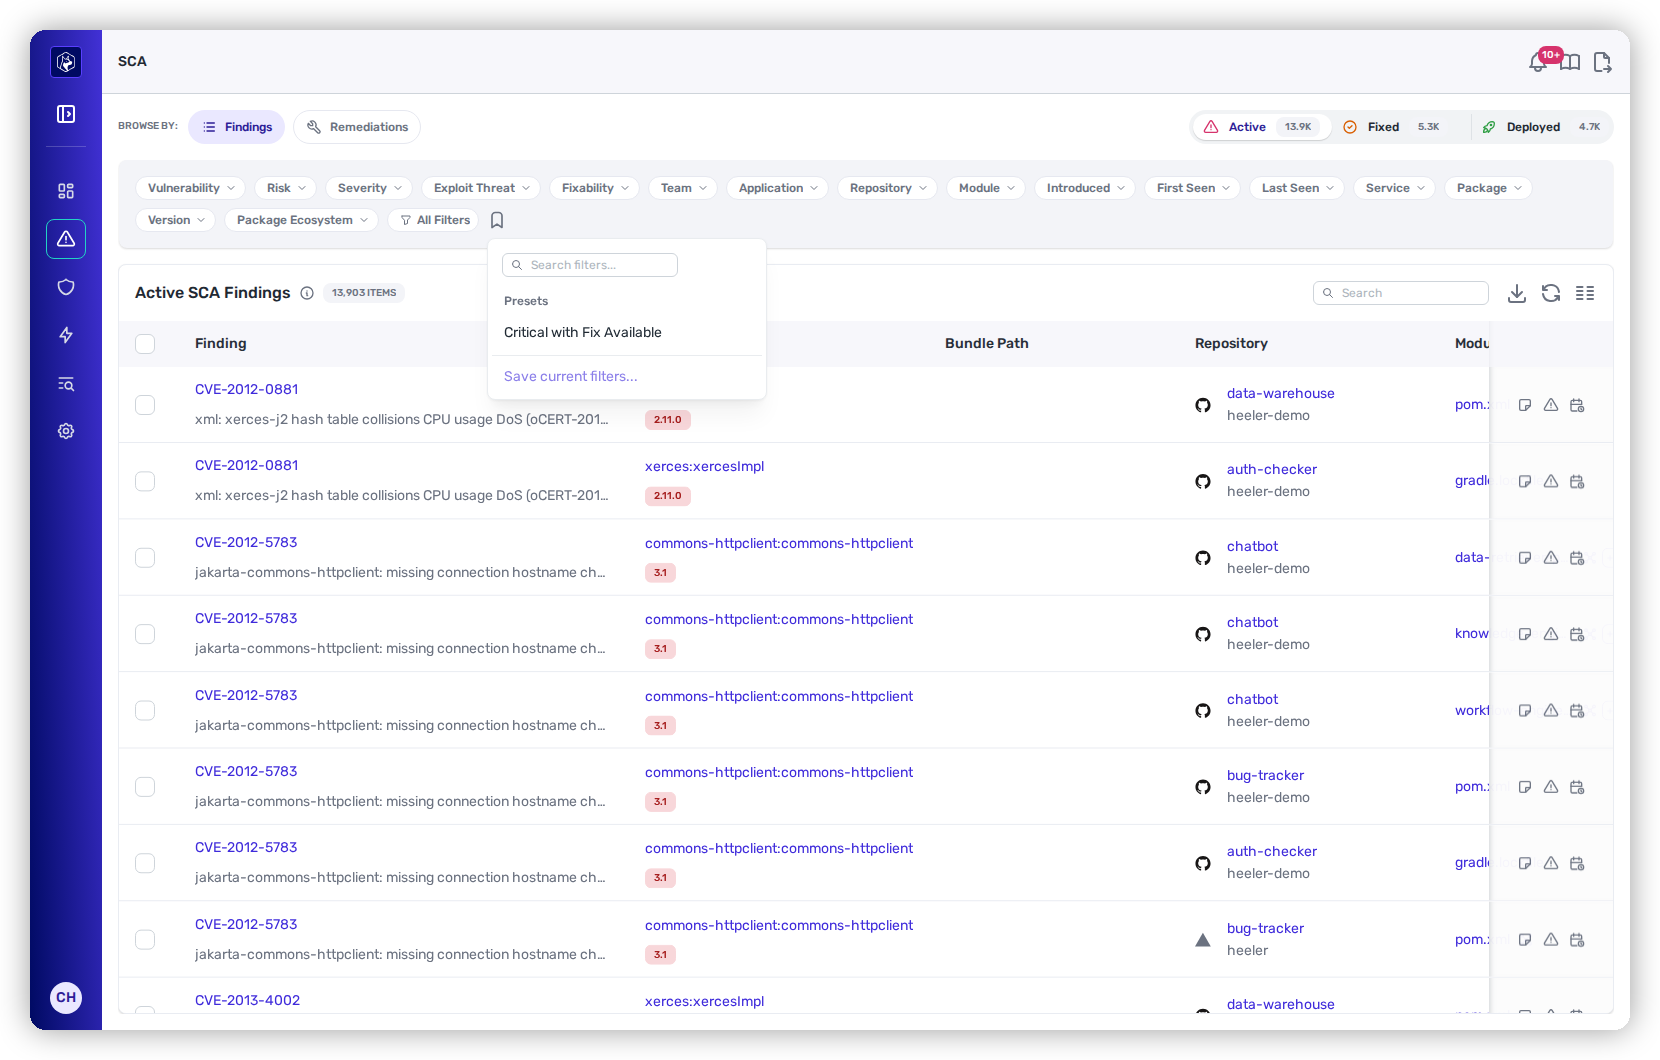
Once you've dialed in a set of filters worth keeping, save it. The **bookmark icon** at the end of the filter row opens **Presets** — your saved views. Click any preset to apply it (for example, a *Critical with Fix Available* view narrows the list to critical findings that have a fix); the matching filter chips light up and the count updates.

<figure><img src="https://414480750-files.gitbook.io/~/files/v0/b/gitbook-x-prod.appspot.com/o/spaces%2FXP3dp2kecwKA2KvYkntz%2Fuploads%2Fgit-blob-dd019a9e539f38d83d3e869a45b4b8e577265c44%2Fcc-sca-presets.png?alt=media" alt="The Presets popover listing saved views with a Save current filters link."><figcaption><p>Saved views live behind the bookmark icon — click one to apply it, or save the filters you have now.</p></figcaption></figure>

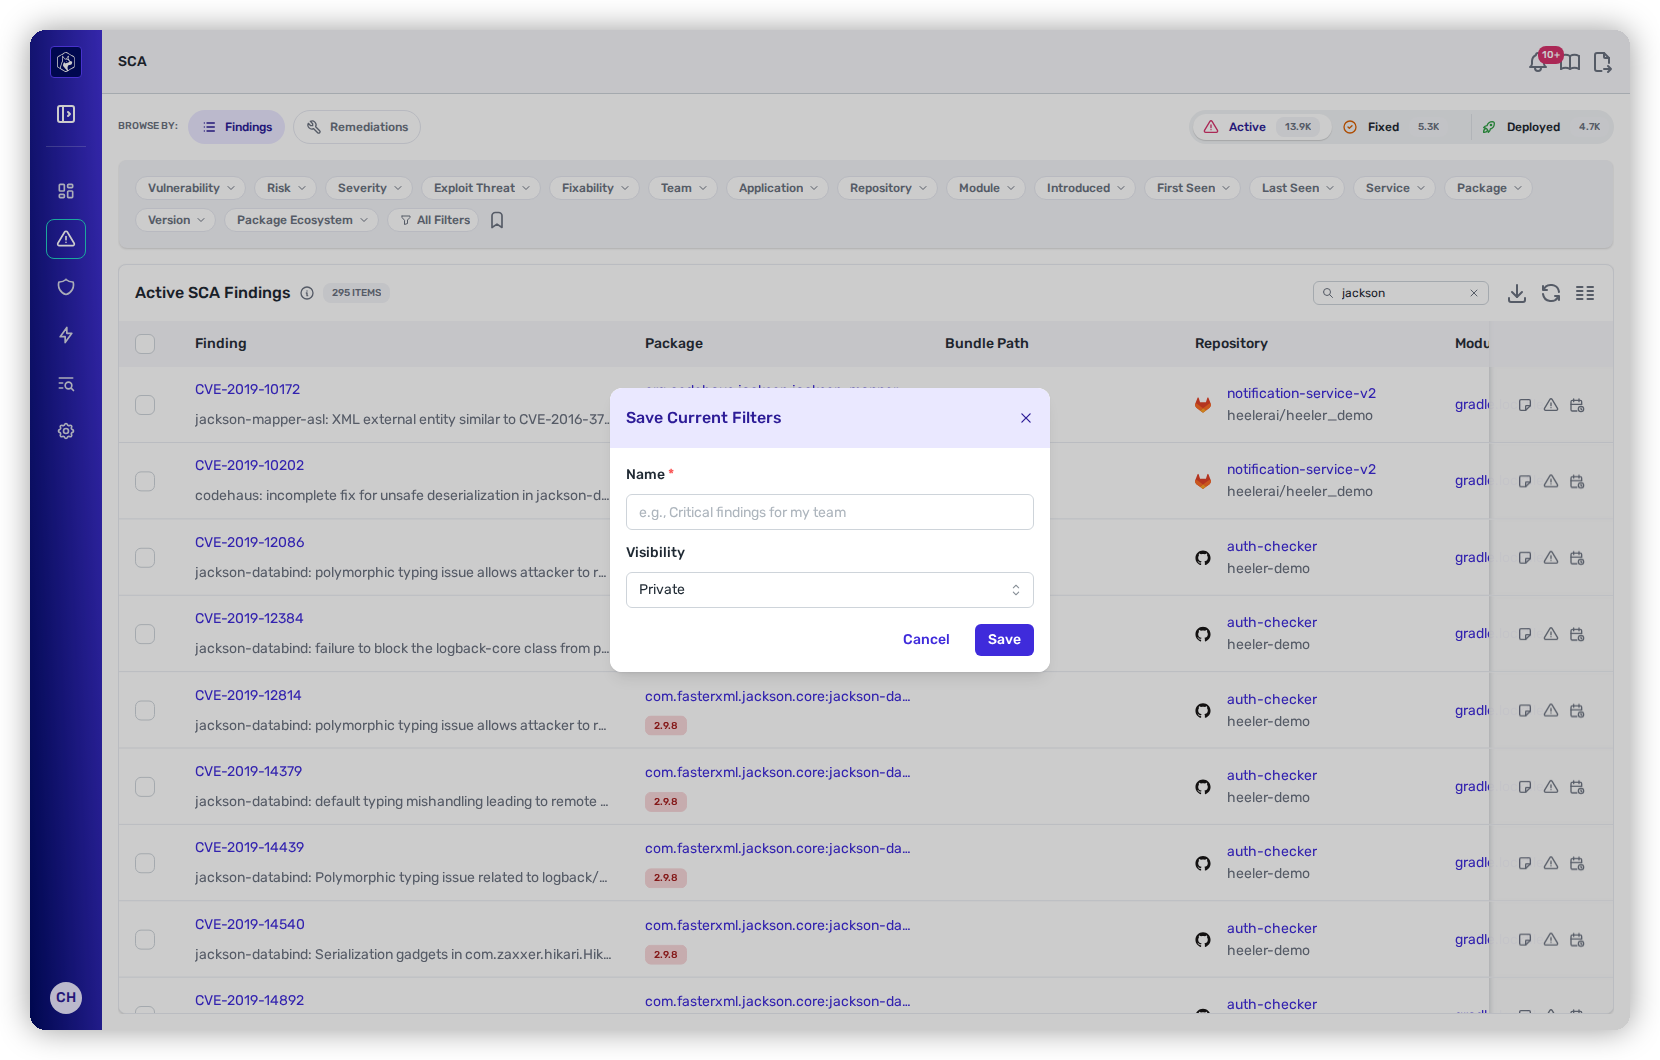
To save what you've got, apply at least one filter, then choose **Save current filters…**. Give the view a name and set its **Visibility**:

* **Private** — just for you.
* **Team** — shared with your team.
* **Organization** — shared with everyone.

<figure><img src="https://414480750-files.gitbook.io/~/files/v0/b/gitbook-x-prod.appspot.com/o/spaces%2FXP3dp2kecwKA2KvYkntz%2Fuploads%2Fgit-blob-062517752503ae95bc4f47c1f3f6112fb6be606b%2Fcc-sca-savedview.png?alt=media" alt="The Save Current Filters dialog with a name field and Private/Team/Organization visibility."><figcaption><p>Name the view and choose who sees it — Private, Team, or Organization.</p></figcaption></figure>

### Sorting

Click any column header to sort by it; click again to flip the direction. An arrow marks the sorted column. Sorting by **Risk** or **SLO** is the fastest way to float the most urgent, closest-to-overdue findings to the top.

### Column layout

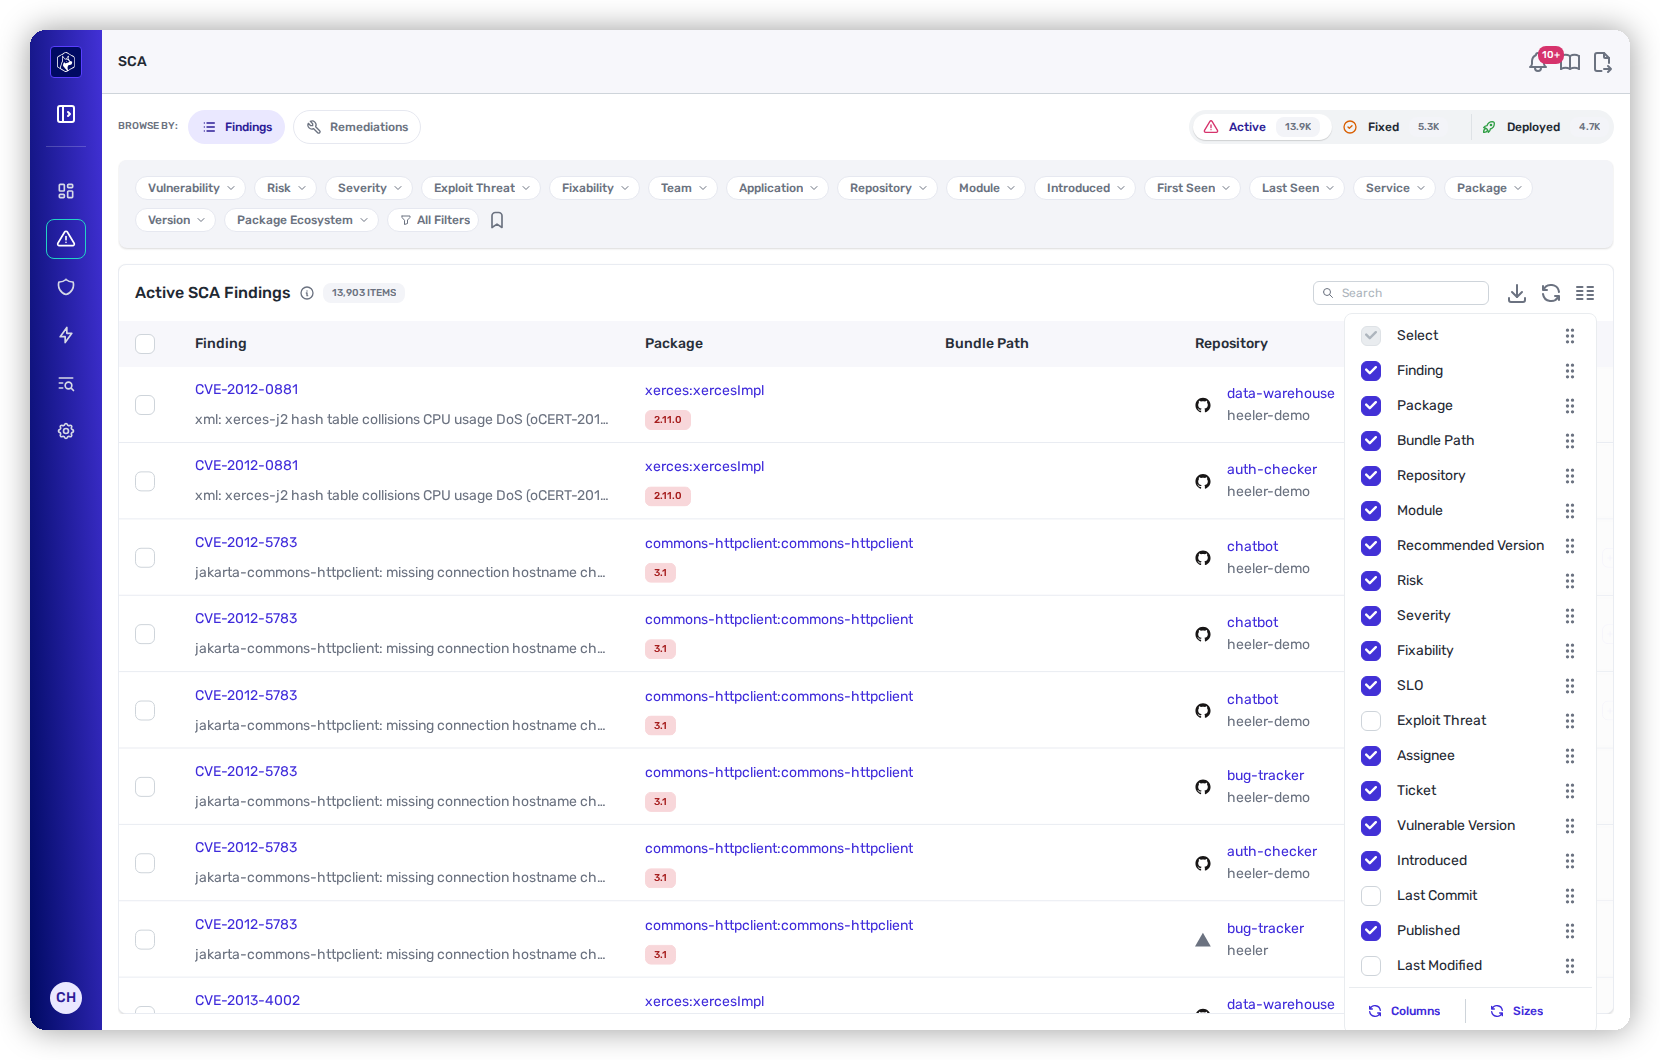
The **Manage Columns** icon opens a panel where you can **show or hide** any column with its checkbox and **reorder** columns by dragging the handle. A **Sizes** tab lets you set column widths. Your layout is remembered **per lifecycle tab** — Active, Fixed, and Deployed each keep their own arrangement — and it persists across visits.

<figure><img src="https://414480750-files.gitbook.io/~/files/v0/b/gitbook-x-prod.appspot.com/o/spaces%2FXP3dp2kecwKA2KvYkntz%2Fuploads%2Fgit-blob-349b730deacc61e10251ad6f572ca1da629ee246%2Fcc-sca-columns.png?alt=media" alt="The Manage Columns panel with visibility checkboxes and drag handles."><figcaption><p>Show, hide, reorder, and resize columns — saved separately for each lifecycle tab.</p></figcaption></figure>

### Export

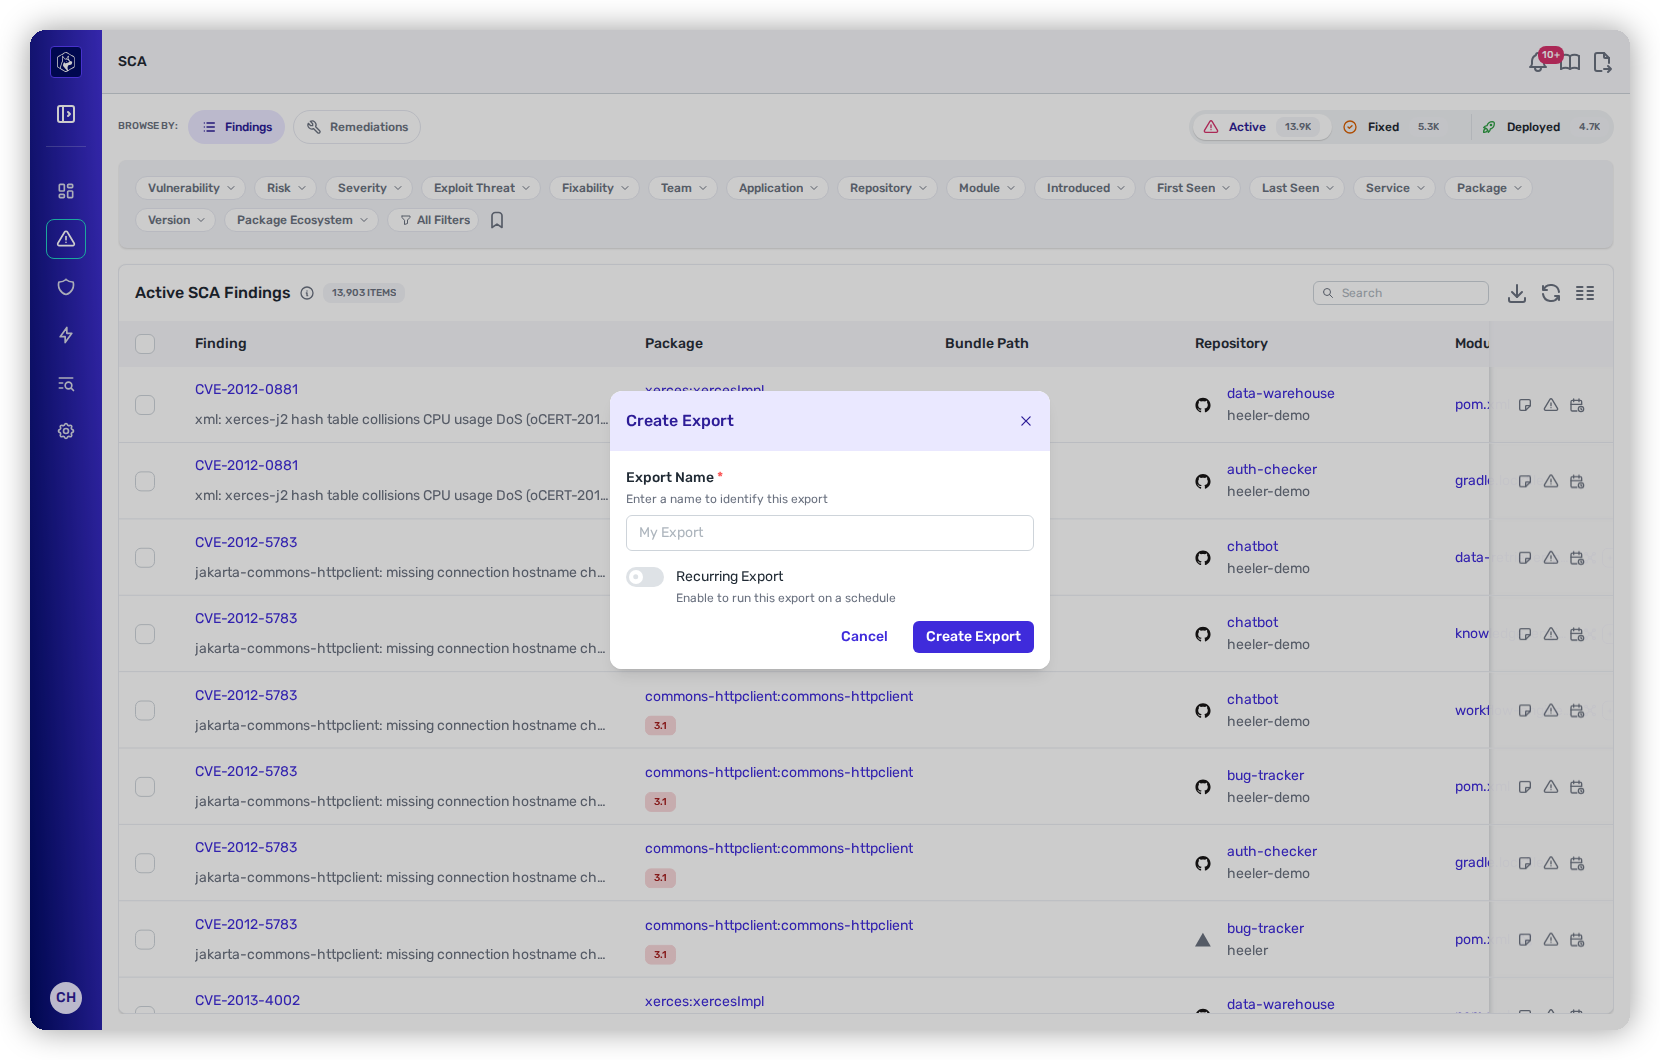
The **Export Data** icon opens **Create Export**, which produces an export of the findings you're currently looking at. Give it a name, and — if you want it to keep running — turn on **Recurring Export** and pick a **Frequency** to have Heeler regenerate it on a schedule. This is the way to feed the current view into a report or an external system on a cadence, rather than exporting by hand each time.

<figure><img src="https://414480750-files.gitbook.io/~/files/v0/b/gitbook-x-prod.appspot.com/o/spaces%2FXP3dp2kecwKA2KvYkntz%2Fuploads%2Fgit-blob-40733069a7d0c35ad3cc2115b994e86c5890c2f7%2Fcc-sca-export.png?alt=media" alt="The Create Export dialog with a name field and a Recurring Export toggle."><figcaption><p>Name an export and, optionally, schedule it to run on a recurring frequency.</p></figcaption></figure>

### Refresh and scrolling

The **Refresh** icon re-runs the current query in place, keeping your filters and sort. The list itself has no page numbers — it **loads more rows as you scroll**, with the total shown as the *N ITEMS* count next to the tab heading.

{% hint style="info" %}
**No bulk selection here.** The Findings list is for triage and tracing individual CVEs — there are no row checkboxes. When you want to fix several things at once, work from [Remediations](/mrecEO40m5D6bt7Pq5pE/findings/open-source-sca/remediations.md), which groups findings into fix units and supports bulk auto-fix.
{% endhint %}

***

## Reading a finding

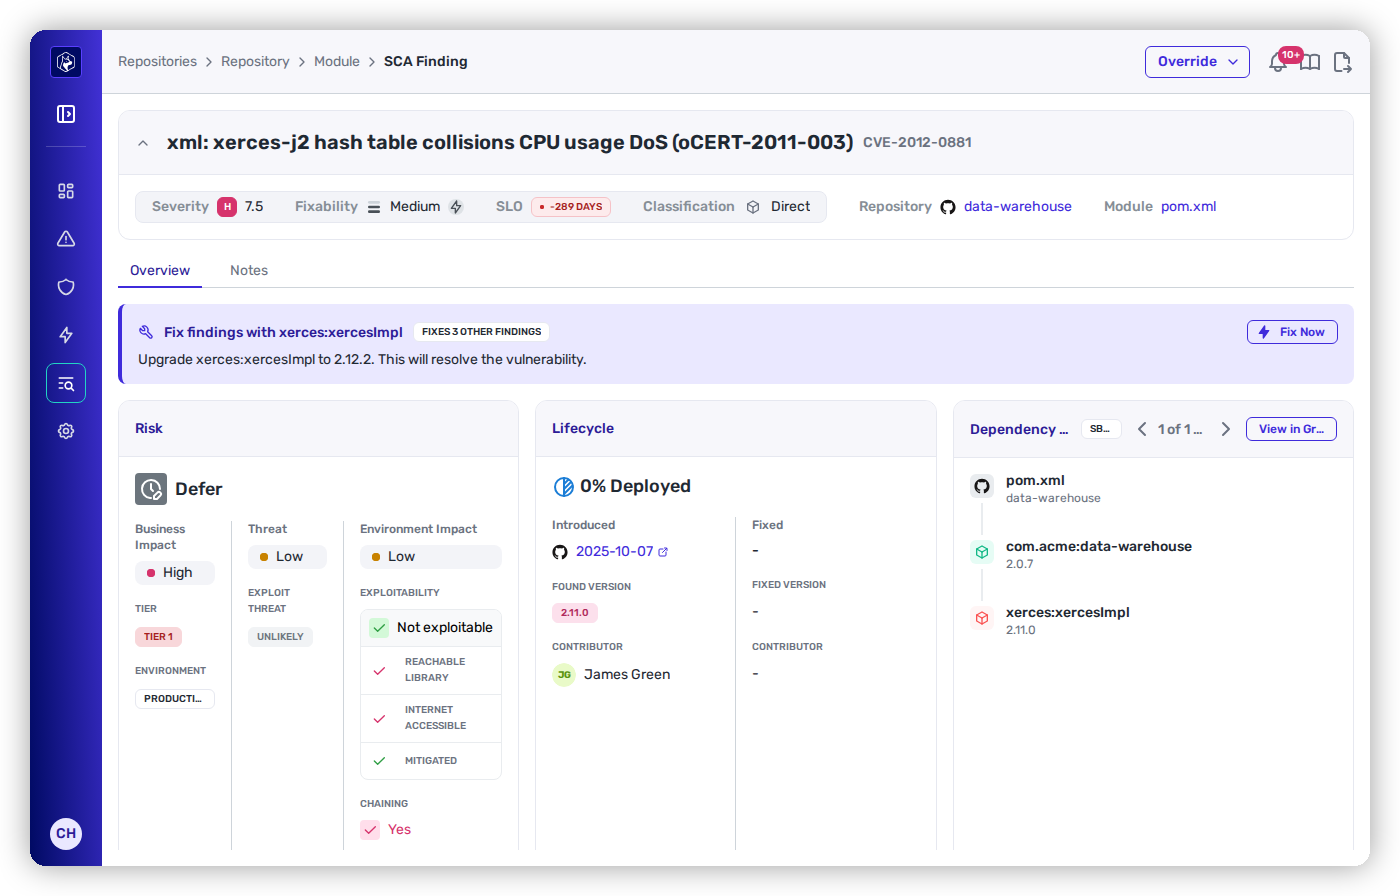
Click a CVE to open its detail page. It opens on the **Overview** tab, with **Notes** alongside — and a **Deployments** tab as well whenever the finding maps to running deployments — plus an **Override** button top-right.

<figure><img src="https://414480750-files.gitbook.io/~/files/v0/b/gitbook-x-prod.appspot.com/o/spaces%2FXP3dp2kecwKA2KvYkntz%2Fuploads%2Fgit-blob-9682d1b6bf01236285eef032e999ed65b29c5b1d%2Fcc-sca-detail.png?alt=media" alt="An SCA finding detail: summary bar, remediation banner, and Overview panels."><figcaption><p>The finding detail, opened on Overview.</p></figcaption></figure>

### The summary bar

Across the top: **Severity** (with CVSS score), **Fixability**, the **SLO** clock, **Dependency Type** (direct or transitive), and the **Repository** and **Module**.

### The remediation banner

Directly below, Heeler names the fix — for example *"Upgrade xerces:xercesImpl to 2.12.2."* When that one upgrade also clears other vulnerabilities, a **"Fixes N other findings"** badge records how many.

### Risk

How the finding earned its band — the **Business**, **Threat**, and **Environment** impact behind it, surfaced as the concrete facts that drove them: **tier**, **environment**, **exploit threat**, **exploitability**, **internet accessibility**, and lifecycle status. See [Prioritization](/mrecEO40m5D6bt7Pq5pE/findings/open-source-sca/prioritization.md) for how these combine.

Above the details, the Overview also shows a **generated finding summary** — a plain-language explanation of the finding in your context — distinct from the CVE's own advisory description further down.

### The lifecycle: tracking a fix to production

This is where Heeler goes beyond "found" and "fixed." Because Heeler correlates your **running deployments** back to source, it tracks a vulnerability all the way to production and tells you when it's *actually gone* — not just merged.

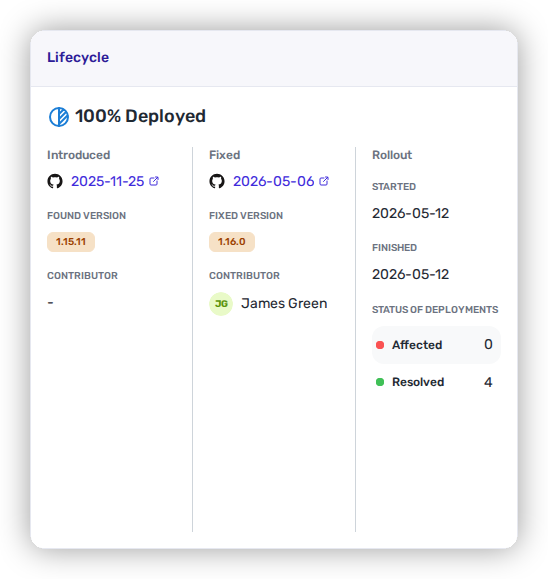
A finding moves through three stages, shown in the **Lifecycle** panel under a **% Deployed** header:

1. **Introduced** — when and where the vulnerability entered: the date, the version it was found in, and the contributor.
2. **Fixed** — when a fix was committed: the fixed version and contributor.
3. **Rollout** — appears once the fix starts reaching production. It shows when rollout **Started**, when it **Finished** (blank while still in progress), and a live tally of **Affected** vs. **Resolved** deployments. **% Deployed** is the share of deployments already on the fix.

<figure><img src="https://414480750-files.gitbook.io/~/files/v0/b/gitbook-x-prod.appspot.com/o/spaces%2FXP3dp2kecwKA2KvYkntz%2Fuploads%2Fgit-blob-87607de0d1e522b23ff1138c368fcf4a7f4abf73%2Fcc-lifecycle-deployed.png?alt=media" alt="The Lifecycle panel at 100% Deployed with the Rollout stage populated."><figcaption><p>A fully rolled-out fix — Rollout shows Started and Finished dates, and no deployment is left Affected.</p></figcaption></figure>

### Dependency Path

How the package is pulled into your build — the tree from the manifest down to the vulnerable package, whether it's a direct or transitive dependency, with a **View in Graph** option and, when there are several routes in, a pager to step through each path.

### More detail

Further down, the finding carries its full **Vulnerability Details** — CVSS vector and score, EPSS probability, CWE, advisory source, and publish dates — along with the affected and fixed version ranges and the finding's description.

***

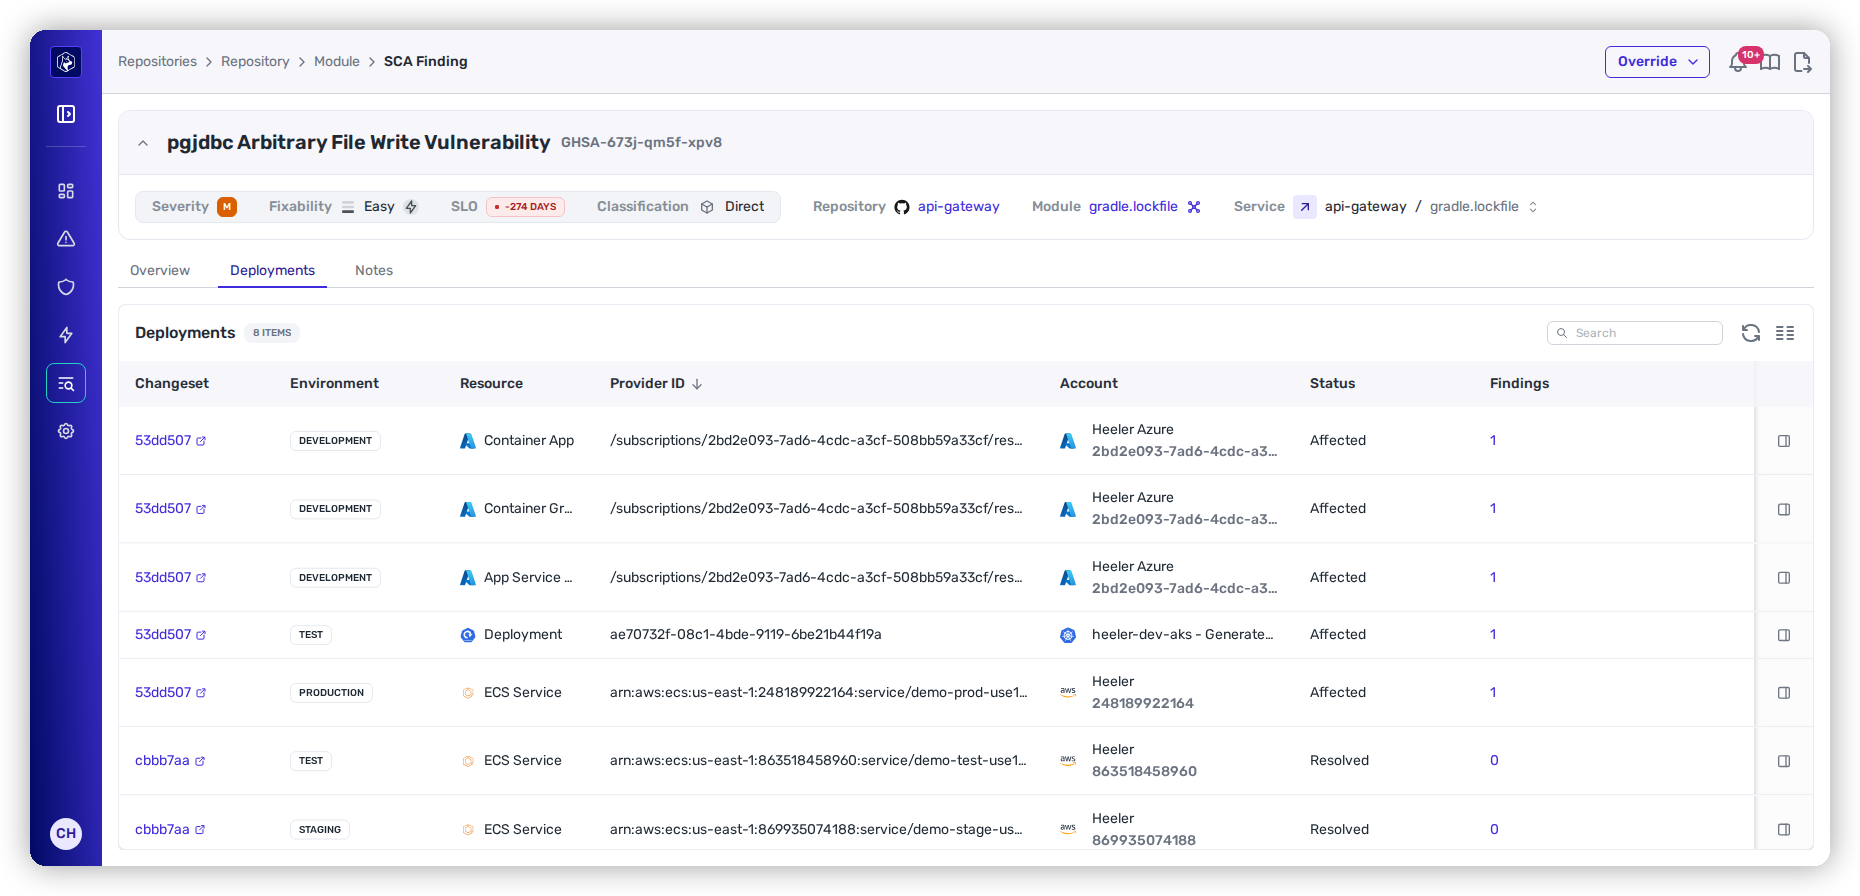
## The Deployments tab

The **Deployments** tab — present whenever the finding maps to running deployments — answers the question a code-only scanner can't: *which of my running deployments still has this?* It lists every deployment the finding touches, and whether each one is clear yet.

<figure><img src="https://414480750-files.gitbook.io/~/files/v0/b/gitbook-x-prod.appspot.com/o/spaces%2FXP3dp2kecwKA2KvYkntz%2Fuploads%2Fgit-blob-dc1eb5a7f881b4cc500ad0c472c663d0b2fbe4f7%2Fcc-deployments.png?alt=media" alt="The Deployments tab showing per-deployment Affected/Resolved status."><figcaption><p>Per-deployment rollout — deployments still on the old changeset are <strong>Affected</strong>; those carrying the fix are <strong>Resolved</strong>.</p></figcaption></figure>

| Column          | What it shows                                                                        |
| --------------- | ------------------------------------------------------------------------------------ |
| **Changeset**   | The deployed commit (short SHA, links to the code).                                  |
| **Environment** | Production · Staging · Test · Development.                                           |
| **Resource**    | The runtime resource — e.g. an ECS Service or a Kubernetes Deployment.               |
| **Provider ID** | The cloud identifier (AWS ARN, Azure resource ID, …).                                |
| **Account**     | The cloud account the deployment runs in.                                            |
| **Status**      | **Affected** (still running vulnerable code) or **Resolved** (on the fixed version). |

This pinpoints the exact deployment holding a fix back — for example, a lagging test environment still on the old changeset while production has already moved on.

***

## The Notes tab

A running log of notes and automatic events (such as SLO changes), with an **Add Note** button and a filter by author. You can also add a note straight from a row in the list, using the note icon at the end of the row.

## Recording an exception

When a finding shouldn't follow the default treatment, open **Override** on the detail page — it's a dropdown offering **Risk** and **SLO**. Each opens a modal that first shows a **read-only summary** for context (current risk, severity, current and default SLO dates, and the recommended version), then a toggle above the fields it controls:

{% tabs %}
{% tab title="Risk Override" %}
Record that the finding is mitigated outside a code fix. The modal opens with **Mitigation applied** switched on:

* **Reason** *(required)* — Not Reachable · Unpinned Version · False Positive · Environment Configuration · Risk Acceptance · Other
* **Description** *(required)* — your justification (up to 300 characters).
* **Expires On** — the date the override lapses. The earliest date you can pick is tomorrow. Leave it empty and the override stands until someone removes it.

On the expiry date the override lapses, the finding returns to the risk Heeler computes for it, and the lapse is recorded in the finding's notes.

Switch **Mitigation applied** off and save to remove an override already in place.
{% endtab %}

{% tab title="SLO Override" %}
Set a custom remediation deadline — turn on **Custom SLO applied**, then:

* **Reason** *(required)* — No Fix Available · Fix Complexity · Not a Priority · Other
* **SLO Due Date** *(required)* — the custom deadline. It can't be earlier than the default due date (or today, if that has already passed), and it can't be more than **one year** past the original.
* **Description** *(required)* — your rationale (up to 300 characters).
  {% endtab %}
  {% endtabs %}

After you save, the finding carries an **Override** badge and appears under the matching **Risk Override** or **SLO Override** filter. Overrides are recorded and can be reviewed anytime with those filters (each also offers a **None** value, to find findings with no exception applied).

To review exceptions across the whole program rather than one finding at a time — what's been accepted, by whom, and what's about to lapse — see [Exceptions and Overrides](/mrecEO40m5D6bt7Pq5pE/operate/exceptions-and-overrides.md).

## Worked example

The same capability inside a full triage workflow:

{% content-ref url="/pages/2ucJQI28WyhzhNQvs51Y" %}
[Determine Exploitability in Production](/mrecEO40m5D6bt7Pq5pE/solutions-and-use-cases/determine-exploitability-in-production.md)
{% endcontent-ref %}

## Related

* [Prioritization](/mrecEO40m5D6bt7Pq5pE/findings/open-source-sca/prioritization.md) — how the Risk band is set.
* [Remediations](/mrecEO40m5D6bt7Pq5pE/findings/open-source-sca/remediations.md) — group findings into fixes and auto-fix in bulk.


---

# Agent Instructions
This documentation is published with GitBook. GitBook is the documentation platform designed so that both humans and AI agents can read, navigate, and reason over technical content effectively. Learn more at gitbook.com.

## Querying This Documentation
If you need additional information that is not directly available in this page, you can query the documentation dynamically by asking a question.

Perform an HTTP GET request on the current page URL with the `ask` query parameter, and the optional `goal` query parameter:

```
GET https://docs.heeler.com/mrecEO40m5D6bt7Pq5pE/findings/open-source-sca/findings.md?ask=<question>&goal=<endgoal>
```

`ask` is the immediate question: it should be specific, self-contained, and written in natural language.
`goal` is optional and describes the broader end goal you are ultimately trying to accomplish on behalf of the user. GitBook uses it to tailor the answer towards what is most useful for that goal.

The response will contain a direct answer to the question and relevant excerpts and sources from the documentation.

Use this mechanism when the answer is not explicitly present in the current page, you need clarification or additional context, or you want to retrieve related documentation sections.