> For the complete documentation index, see [llms.txt](https://docs.heeler.com/mrecEO40m5D6bt7Pq5pE/llms.txt). Markdown versions of documentation pages are available by appending `.md` to page URLs; this page is available as [Markdown](https://docs.heeler.com/mrecEO40m5D6bt7Pq5pE/operate/dashboards/coverage.md).
# Coverage
Prove your analysis is complete and current — what's being scanned, how deeply, whether coverage keeps pace with engineering, and which threats just emerged.
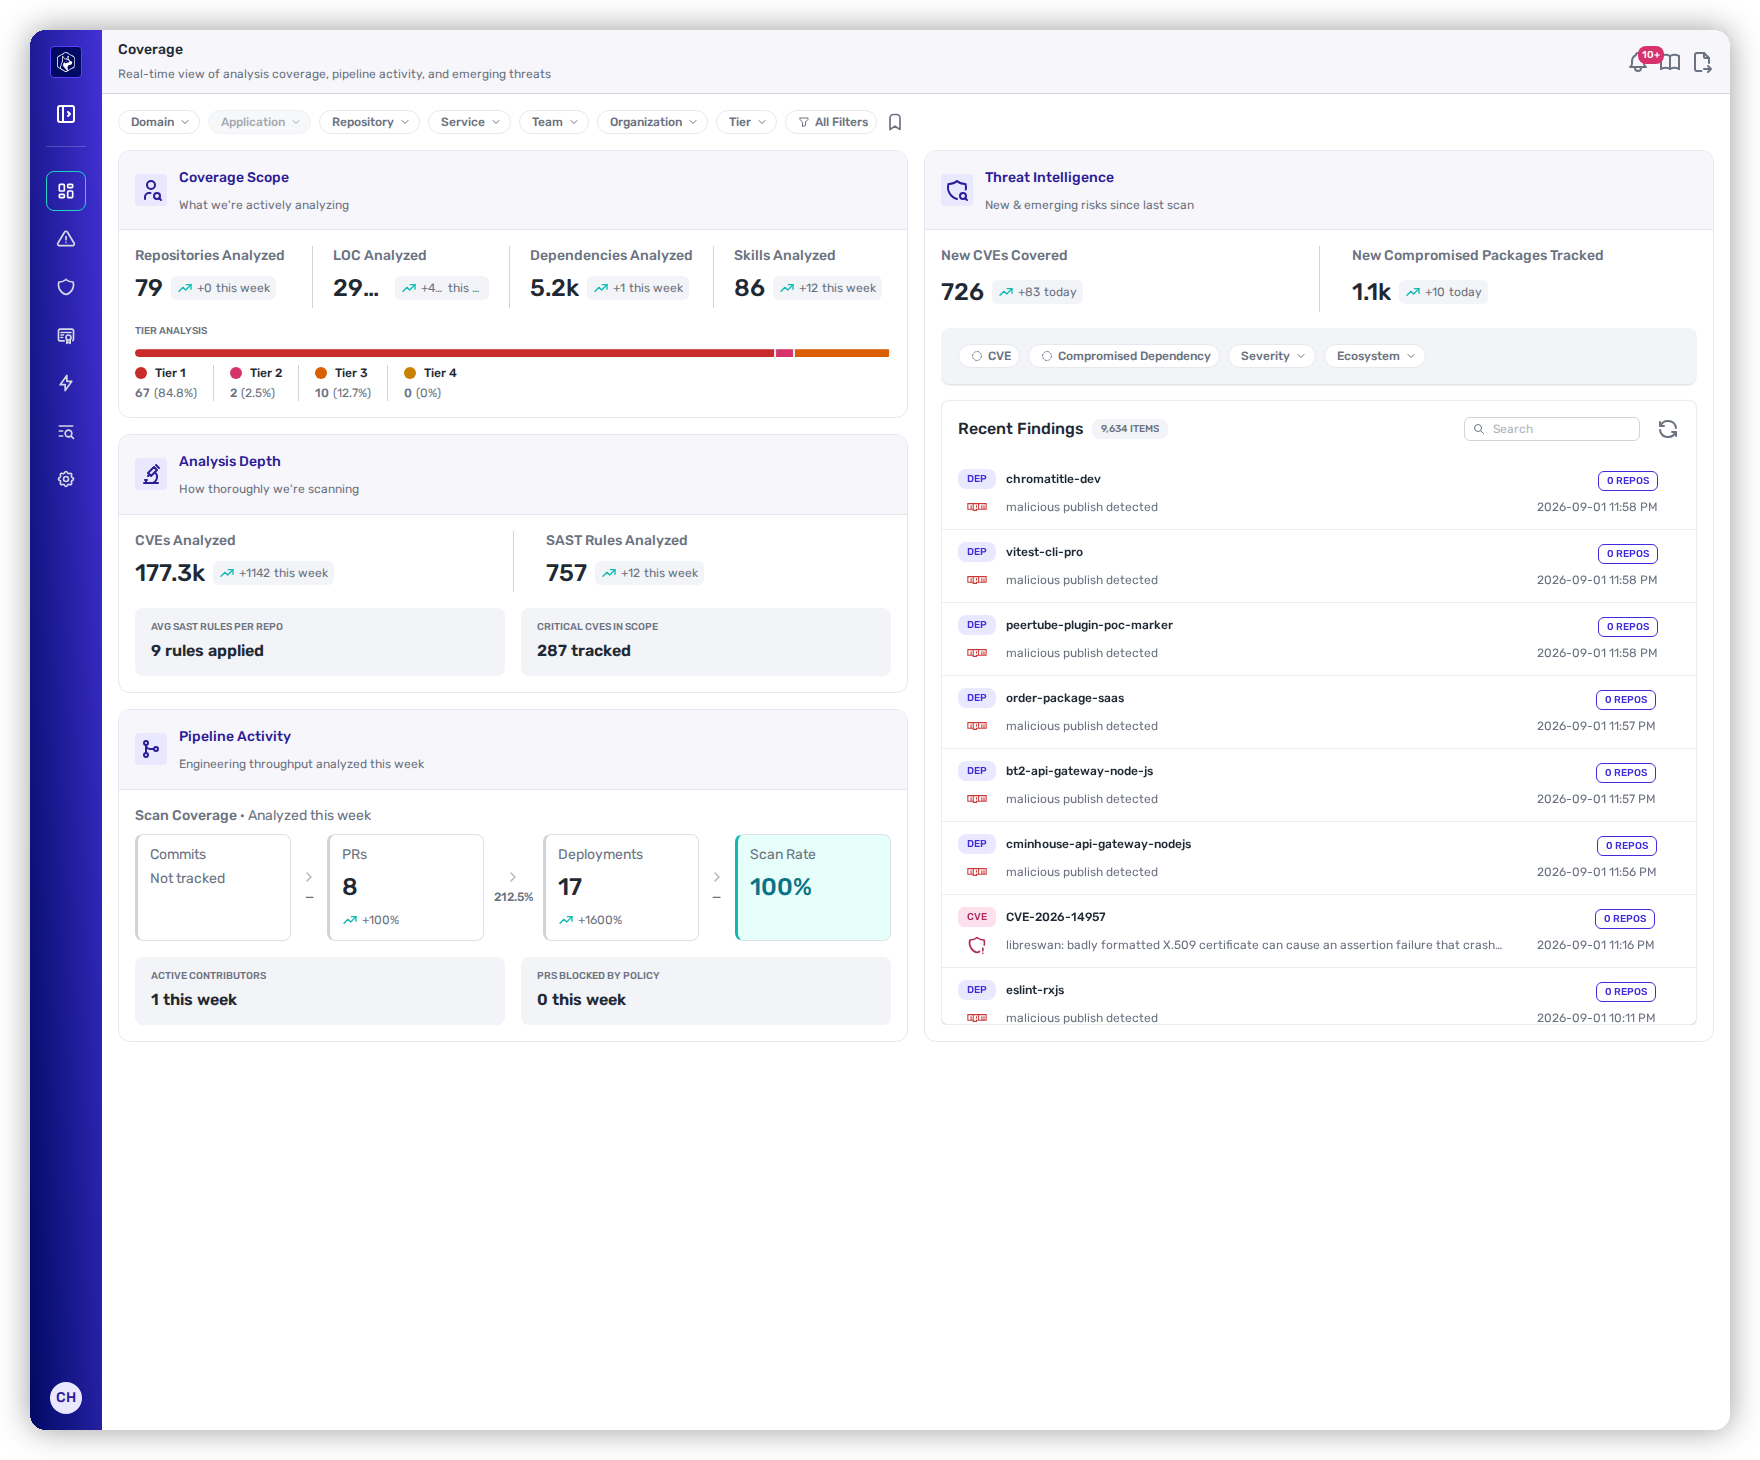
Every other dashboard is about the findings. **Coverage** (**Dashboards → Coverage**) is about the *analysis behind* them — it answers a different question: **are we actually looking at everything?** It's the dashboard you point to when someone asks whether a repository, a new dependency, or a critical service is really in scope, and whether scanning is keeping up with how fast your teams ship.
Coverage — scope and depth on the left, engineering throughput and emerging threats on the right.
The page header shows when the data was **last refreshed**. Like every dashboard, Coverage respects the [global filters](/mrecEO40m5D6bt7Pq5pE/operate/dashboards/filtering-and-exports.md#the-global-filter-bar) — with the exceptions marked **Global** below: the two corpus counts in Analysis Depth and the Threat Intelligence panel report the same figures whatever the filter bar selects.
{% hint style="info" %}
**For:** AppSec teams proving analysis completeness, and leaders reporting on scope. These numbers only reflect reality once the [operating loop is connected](/mrecEO40m5D6bt7Pq5pE/get-started.md) — code, cloud, and runtime.
{% endhint %}
## Coverage Scope
*What we're actively analyzing.* Each metric carries a week-over-week change indicator.
| Metric | What it counts |
| ------------------------- | -------------------------------------------------------------------------------------------------------------------------------------- |
| **Repositories Analyzed** | Repositories currently under analysis. |
| **LOC Analyzed** | Lines of code analyzed across them. |
| **Dependencies Analyzed** | Distinct dependencies resolved and assessed. |
| **Skills Analyzed** | AI-agent skill and instruction files assessed (see [Agent Files](/mrecEO40m5D6bt7Pq5pE/findings/agentic-supply-chain-agent-files.md)). |
A **Tier Analysis** bar breaks analyzed repositories down by effective tier (Tier 1–4): each repository counts once, under the highest tier of the applications it belongs to (Tier 1 when it belongs to none). The **Tier** filter selects repositories with *any* application at the chosen tier, so a Tier 2 selection can show a repository under Tier 1 when it also belongs to a Tier 1 application.
## Analysis Depth
*How thoroughly we're scanning.* Scope tells you *what's* in; depth tells you *how much* analysis is applied to it.
| Metric | What it counts |
| --------------------------- | ----------------------------------------------------------------------------------------------------------------------------------------------------------------------------------------------------------------------------------------------------- |
| **CVEs Analyzed** | Total CVEs in the corpus Heeler evaluates. **Global**: the same for every tenant and unaffected by the filter bar. |
| **SAST Rules Analyzed** | Code-security rules in force across the corpus. **Global**: unaffected by the filter bar. |
| **Avg SAST rules per repo** | Average rules applied per repository — a reflection of language- and framework-aware [rule selection](/mrecEO40m5D6bt7Pq5pE/findings/code-security-sast/rules-and-categories.md), not a flat pack. Follows the filter bar and your repository access. |
| **Critical CVEs in Scope** | Critical CVEs currently active in the repositories in scope. Follows the filter bar and your repository access. |
## Pipeline Activity
*Engineering throughput analyzed this week.* This panel is where you confirm scanning is keeping pace with development, with week-over-week deltas.
| Metric | What it shows |
| ------------------------- | ------------------------------------------------------------------------------------------------- |
| **Commits** | Commit volume analyzed (shows *Not tracked* where per-commit data isn't available). |
| **PRs** | Pull requests evaluated. |
| **Deployments** | Deployments observed. |
| **Scan Rate** | The share of activity that was scanned, with a scanned / unscanned split under **Scan Coverage**. |
| **Active Contributors** | Distinct contributors with PR activity this week. |
| **PRs Blocked by Policy** | Pull requests stopped by a [guardrail](/mrecEO40m5D6bt7Pq5pE/prevent/pr-guardrails.md). |
## Threat Intelligence
*Heeler's global threat feed over the last 7 days.* This panel is marked **Global**: neither the two counts nor the Recent Findings feed changes with the filter bar, so it stays informative when the rest of the page is filtered to one team.
| Metric | What it shows |
| ------------------------------------ | ------------------------------------------------------------------------------------------ |
| **New CVEs Covered** | Newly announced CVEs ingested (7-day window, with a same-day count). |
| **New Compromised Packages Tracked** | Newly identified compromised packages being tracked (7-day window, with a same-day count). |
Below the counts, a **Recent Findings** feed lists the newest relevant items — new CVEs and compromised dependencies — each showing how many of your repositories it affects and when it was observed. The feed has its own **search** and can be filtered to **CVE** or **Compromised Dependency**.
{% hint style="info" %}
"Affects **0 repos**" on a compromised-package entry is good news, not a gap — it means Heeler is tracking a threat that hasn't reached your codebase. If that number is ever non-zero, the package is already in your inventory and worth immediate attention.
{% endhint %}
## Reading coverage as a number
Coverage turns *"are we looking at everything?"* into a number you can report. It records whether new repositories, dependencies and agent files are being picked up, whether critical services are in scope, whether scanning is keeping pace with how fast teams ship, and whether threat intelligence is current. A gap appears here before it appears in the findings.
## Related
* [The Catalog](/mrecEO40m5D6bt7Pq5pE/catalog.md) — the full inventory behind these scope numbers.
* [Priorities](/mrecEO40m5D6bt7Pq5pE/operate/dashboards/priorities.md) — the findings that this analysis produces.
* [Agent Files](/mrecEO40m5D6bt7Pq5pE/findings/agentic-supply-chain-agent-files.md) — what "Skills Analyzed" covers.
---
# Agent Instructions
This documentation is published with GitBook. GitBook is the documentation platform designed so that both humans and AI agents can read, navigate, and reason over technical content effectively. Learn more at gitbook.com.
## Querying This Documentation
If you need additional information that is not directly available in this page, you can query the documentation dynamically by asking a question.
Perform an HTTP GET request on the current page URL with the `ask` query parameter, and the optional `goal` query parameter:
```
GET https://docs.heeler.com/mrecEO40m5D6bt7Pq5pE/operate/dashboards/coverage.md?ask=&goal=
```
`ask` is the immediate question: it should be specific, self-contained, and written in natural language.
`goal` is optional and describes the broader end goal you are ultimately trying to accomplish on behalf of the user. GitBook uses it to tailor the answer towards what is most useful for that goal.
The response will contain a direct answer to the question and relevant excerpts and sources from the documentation.
Use this mechanism when the answer is not explicitly present in the current page, you need clarification or additional context, or you want to retrieve related documentation sections.