> For the complete documentation index, see [llms.txt](https://docs.heeler.com/mrecEO40m5D6bt7Pq5pE/llms.txt). Markdown versions of documentation pages are available by appending `.md` to page URLs; this page is available as [Markdown](https://docs.heeler.com/mrecEO40m5D6bt7Pq5pE/operate/dashboards/priorities.md).
# Priorities
The day-to-day command center — new and critical findings across SCA, SAST, and Secrets, what's approaching SLO, and the exceptions that need a second look.
The **Priorities** dashboard (**Dashboards → Priorities**) is where the security team starts the day. It pulls the most time-sensitive signals from all three finding domains — dependency vulnerabilities (SCA), source-code findings (SAST), and secrets — into one screen: what is new, what is critical, what is about to breach SLO, and what needs a decision.
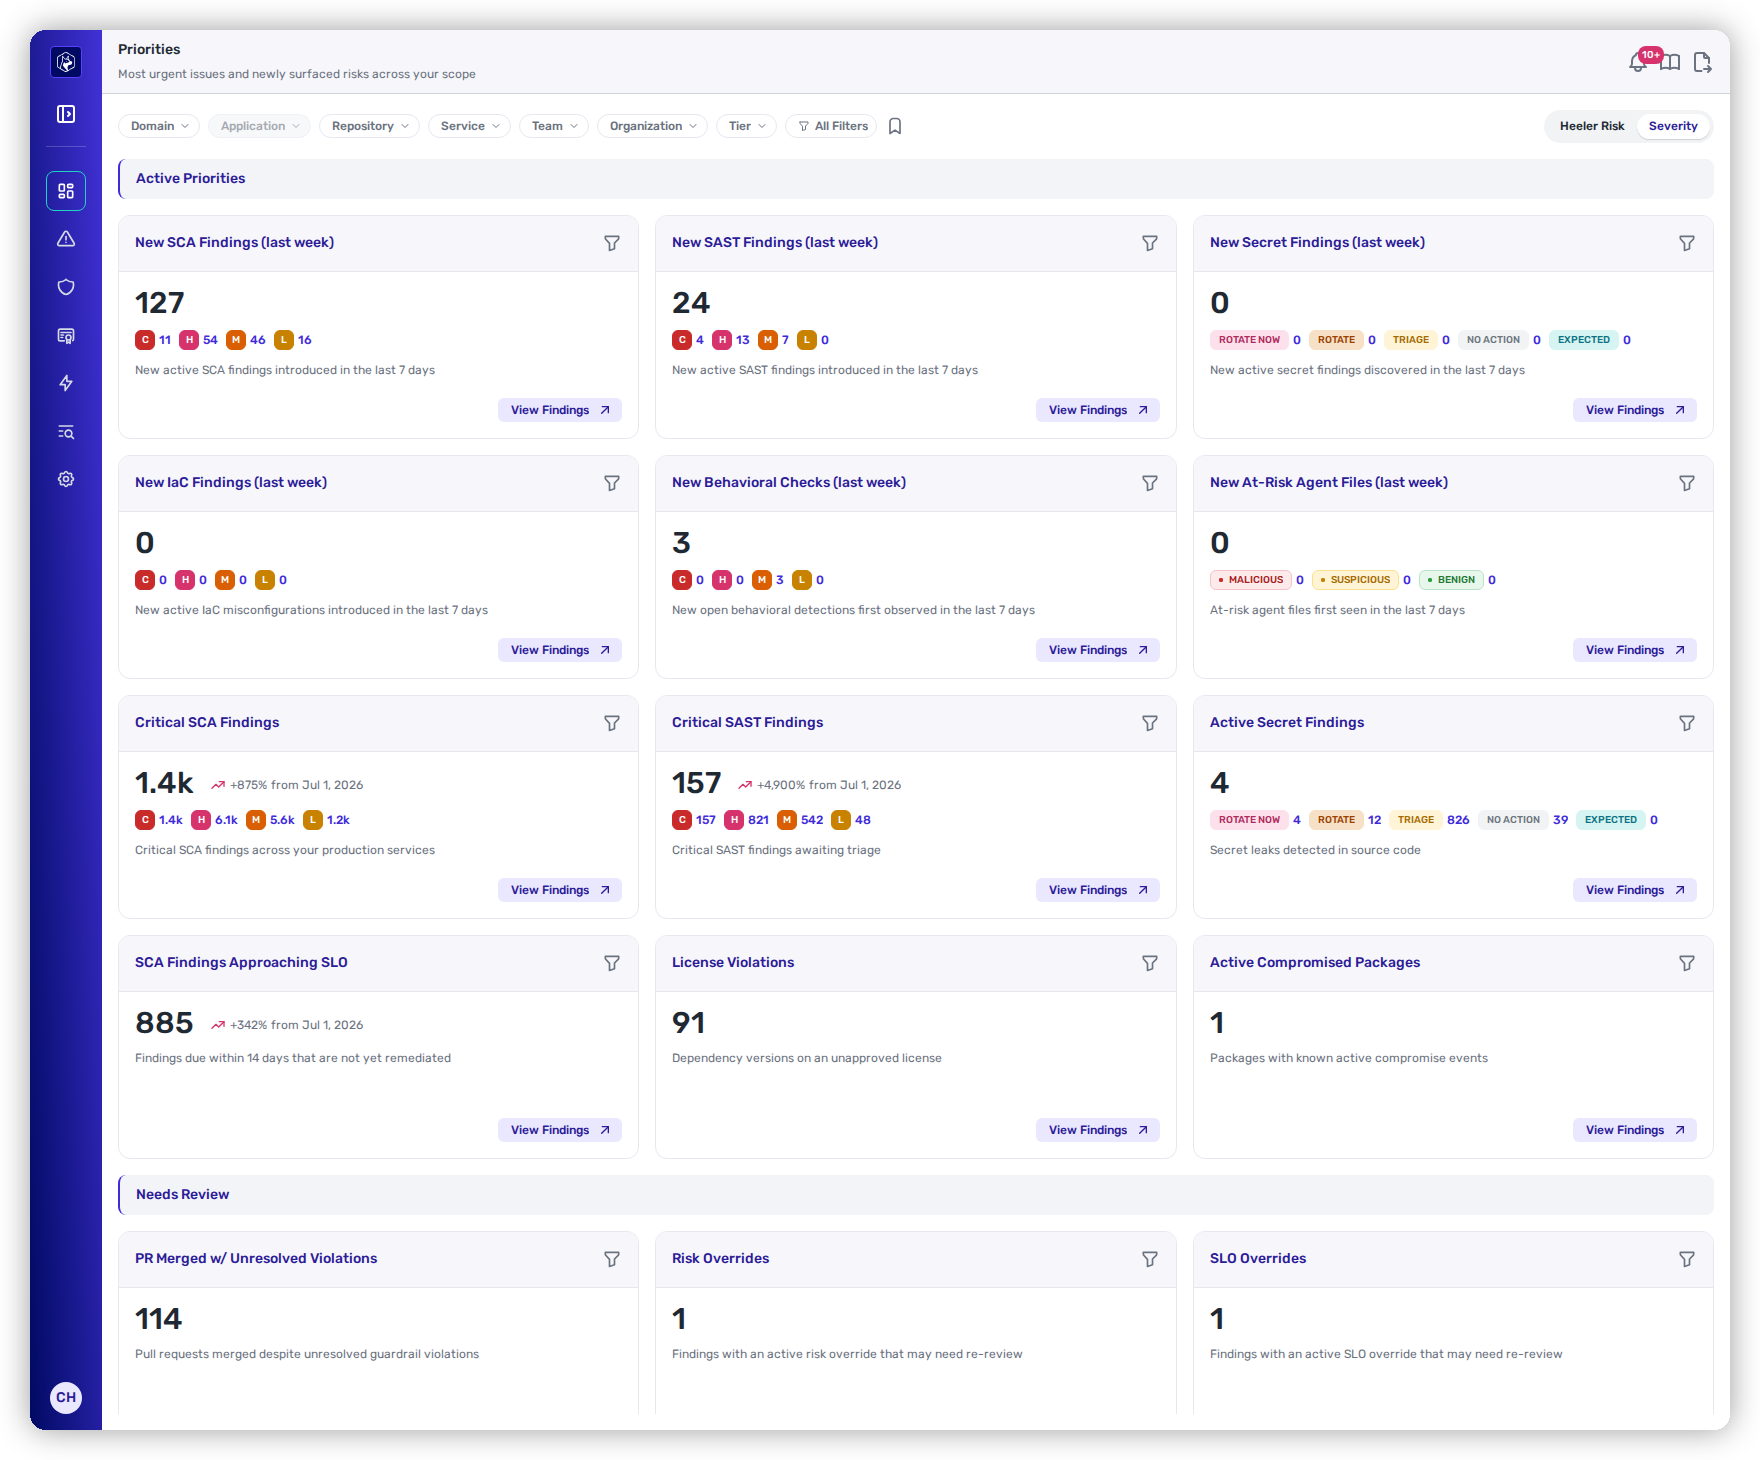
The Priorities dashboard — Active Priorities across every domain, each card a shortcut into the filtered finding list.
Everything on the page respects the [global filters](/mrecEO40m5D6bt7Pq5pE/operate/dashboards/filtering-and-exports.md#the-global-filter-bar) at the top, which narrow the whole dashboard to a team, a tier or a single application. Every card is also a **shortcut**: click a card (or one of its severity chips) to jump straight to the underlying finding list, already filtered to exactly what the card counts.
{% hint style="info" %}
**For:** The security team's daily triage. The cards populate only once the [operating loop is connected](/mrecEO40m5D6bt7Pq5pE/get-started.md) — code, cloud, and runtime — so findings are scored by real exposure.
{% endhint %}
## Active Priorities
The top section is the "what's on fire" view — new intake in the last seven days, and the standing critical and time-critical work.
Cards are graded on the scale your programme runs on: where your SLOs are configured on **Heeler Risk**, the cards group by Heeler Risk; where they run on CVSS severity, the cards group by severity. A **Heeler Risk / Severity** toggle at the top right switches the current view between the two. On the **New** cards the toggle changes the breakdown chips only; the headline count is the same on either scale.
Secret cards report the five action buckets — **Rotate Now**, **Rotate**, **Triage**, **No Action** and **Expected** — rather than a raw validation status. See [Secrets](/mrecEO40m5D6bt7Pq5pE/findings/secrets.md#the-five-action-buckets).
| Card | What it shows | Act on it |
| --------------------------------------- | --------------------------------------------------------------------------------------------------------------------------------------------------------------------------------------------------------- | ---------------------------------------------------------------------------- |
| **New SCA Findings (last week)** | All new active dependency findings from the last 7 days, split **Critical / High / Medium / Low** or **Urgent / Plan / Defer**. Findings outside those chips are counted under **Other** or **Unscored**. | Click a chip to open those findings, or **View Findings** for the full set. |
| **New SAST Findings (last week)** | All new active source-code findings from the last 7 days, with the same breakdown. | Same — drill into the new SAST work. |
| **New Secret Findings (last week)** | New secret findings from the last 7 days, split across the five action buckets. | Start with **Rotate Now** — those are confirmed-live credentials. |
| **New IaC Findings (last week)** | All new active infrastructure-as-code misconfigurations from the last 7 days, with the same breakdown. | Drill into what the week's template changes introduced. |
| **New Behavioral Checks (last week)** | Behavioral detections first observed in the last 7 days, by severity. | Investigate the activity behind each detection. |
| **New At-Risk Agent Files (last week)** | Agent files first seen in the last 7 days, split by assessed intent **Malicious / Suspicious / Benign**. | Start with **Malicious**, then **Suspicious**. |
| **Critical SCA Findings** | Total Critical dependency findings across production services, with the change vs. the prior period and a full severity breakdown. | The standing critical backlog to burn down. |
| **Critical SAST Findings** | Total Critical source-code findings awaiting triage, with a severity breakdown. | Triage queue for code weaknesses. |
| **Active Secret Findings** | Confirmed-live secret count, with all open secrets split across the five action buckets. | Start with **Rotate Now**, then work the remaining buckets in urgency order. |
| **SCA Findings Approaching SLO** | Findings due within the next 14 days that aren't yet remediated, with the change vs. the prior period. | The deadline queue — clear these before they breach. |
| **License Violations** | Dependency versions on an unapproved license. | Opens the License Violations list. |
| **Active Compromised Packages** | Packages in your codebase with known active compromise events. | Opens the Compromised Dependencies list — treat as urgent. |
{% hint style="info" %}
The **"last week"** cards count *new intake* — risk that appeared in the last 7 days. The **Critical** cards count the *standing total*, so a quiet week can still show a large critical backlog. Read them together: intake tells you whether things are getting worse, the totals tell you how big the hole is.
{% endhint %}
### Other and Unscored chips
A gray chip holds the findings the card's breakdown does not place in a named chip.
On the **New SCA**, **New SAST** and **New IaC** cards it follows the selected scale:
* **Unscored** (Heeler Risk view) — findings not yet assigned a Heeler Risk. Scoring runs after ingest, so a finding can sit unscored for a while and still be counted.
* **Other** (Severity view) — findings whose severity is outside Critical, High, Medium and Low: **Info**, **None**, **Unknown**, or no severity recorded at all.
On **New Secret Findings** and **Active Secret Findings** the same gray **Other** chip holds secrets whose validation status maps to none of the five action buckets.
The chip appears only when its count is non-zero and has no drilldown of its own; **View Findings** opens the full list. The headline equals the sum of the chips and matches the list the card opens.
## Needs Review
The middle section surfaces decisions, not findings — places where something was bypassed, overridden, or granted an extension and should be re-examined so exceptions don't quietly pile up.
| Card | What it shows | Why it matters |
| -------------------------------------- | ------------------------------------------------------------------------------ | ------------------------------------------------------------------------------------ |
| **PR Merged w/ Unresolved Violations** | Pull requests merged despite an unresolved guardrail violation. | Someone proceeded past a flagged issue — confirm it was intentional, not overlooked. |
| **Risk Overrides** | Findings with an active risk override that may need re-review. | Overrides expire and context changes; this keeps exceptions honest. |
| **SLO Overrides** | Findings with an active SLO override (an extended deadline) worth re-checking. | Make sure extended deadlines are still justified. |
## Trend cards
The bottom row gives a quick read on direction — is the program pulling ahead of incoming risk, or falling behind?
| Card | What it tells you |
| ----------------------------------------------- | ---------------------------------------------------------------------------------------------------------------------------------------------------------- |
| **Introduced vs Emerged** | Whether new risk is coming from *code changes* (new packages you added) or from *newly published CVEs* against dependencies you already had. |
| **New vs Remediated SCA Findings (Last Month)** | Created vs. remediated over the last 30 days — are you net reducing the open count, or losing ground? |
| **SLO Compliance — SCA Findings** | The share of SCA findings remediated within their SLO over the last 90 days, with the change vs. the prior period. This is the headline compliance number. |
{% hint style="success" %}
Use the trend cards to frame the daily work: if **New vs Remediated** is trending the wrong way, the intake cards up top tell you *where* the new risk is coming from, and the **Remediation Workbench** tells you the fastest way to catch up.
{% endhint %}
## Scoping the dashboard
The filter bar and saved views work the same as everywhere else in this section — see [Filtering and Exports](/mrecEO40m5D6bt7Pq5pE/operate/dashboards/filtering-and-exports.md). Scoping to a **Team** turns Priorities into that team's personal command center; scoping to **Tier 1** focuses everyone on the services that matter most.
## Related
* [Remediation Workbench](/mrecEO40m5D6bt7Pq5pE/operate/dashboards/remediation-workbench.md) — turn priorities into a plan of attack.
* [Fix → Prioritize (Heeler Risk)](/mrecEO40m5D6bt7Pq5pE/fix/prioritize-heeler-risk.md) — how findings are sequenced into Urgent / Plan / Defer.
* [Coverage](/mrecEO40m5D6bt7Pq5pE/operate/dashboards/coverage.md) — confirm the analysis behind these numbers is complete and current.
---
# Agent Instructions
This documentation is published with GitBook. GitBook is the documentation platform designed so that both humans and AI agents can read, navigate, and reason over technical content effectively. Learn more at gitbook.com.
## Querying This Documentation
If you need additional information that is not directly available in this page, you can query the documentation dynamically by asking a question.
Perform an HTTP GET request on the current page URL with the `ask` query parameter, and the optional `goal` query parameter:
```
GET https://docs.heeler.com/mrecEO40m5D6bt7Pq5pE/operate/dashboards/priorities.md?ask=&goal=
```
`ask` is the immediate question: it should be specific, self-contained, and written in natural language.
`goal` is optional and describes the broader end goal you are ultimately trying to accomplish on behalf of the user. GitBook uses it to tailor the answer towards what is most useful for that goal.
The response will contain a direct answer to the question and relevant excerpts and sources from the documentation.
Use this mechanism when the answer is not explicitly present in the current page, you need clarification or additional context, or you want to retrieve related documentation sections.